
Kathryn Prociv
@KathrynProciv
Meteorologist for @NBCNews🦚, EVP @monarchweather🦋. Emmy Award-Winning. Former @WeatherChannel @capitalweather @ustornadoes🌪. MS & CCM #GoHokies! Views my own
The comfortable air over the Northeast and Mid-Atlantic on Tuesday took a winding, 4,500 mile journey from Banks Island in the Arctic over the past week. If it were January, it would be frigid. But in July, it's fantastic. Enjoy it! 😎
Word is out—we've released our initial 2025 fall foliage predictions! It's important to remember that at this point in the season, our maps try to depict "normal" timing. As fall approaches, we begin to fine tune the forecast to match regional anomalies!
🍂 @ExploreFall has issued its first foliage outlook for 2025! ⬇️ wral.com/autumn-in-two-…
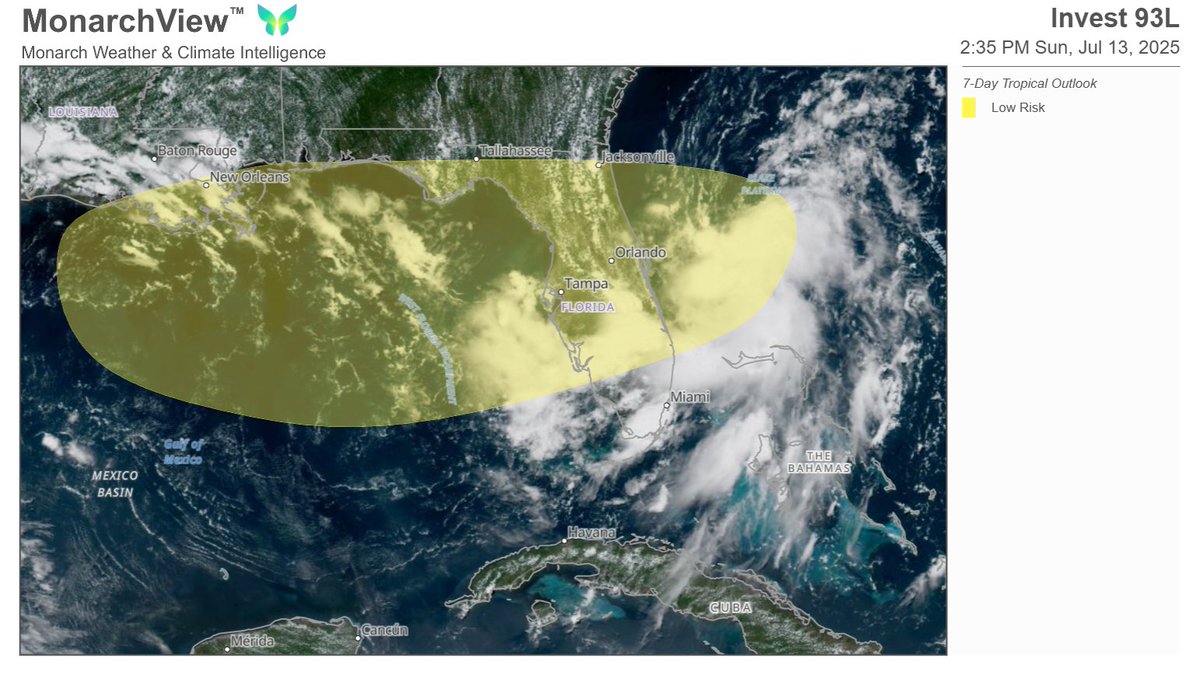
So far in 2025, more flood warnings have been issued by @NWS than any year on record (since 1986). Monday was no exception, with 96 flood warnings across the country, the most of any July calendar day. Invest 93L threatens to continue the trend this week. michaelrlowry.substack.com/p/tropical-dis…
ALERT: Howard County Police are shutting down Main Street in Historic Ellicott City due to significant rainfall and reported water starting to appear on the roadway. The Outdoor Tone Alert System has been activated. If you are in Historic Ellicott City, please seek higher ground…
We now have Invest 93L. NHC also expanded the development area eastward, across the Florida Peninsula, to include the Atlantic given the recent convective trends.
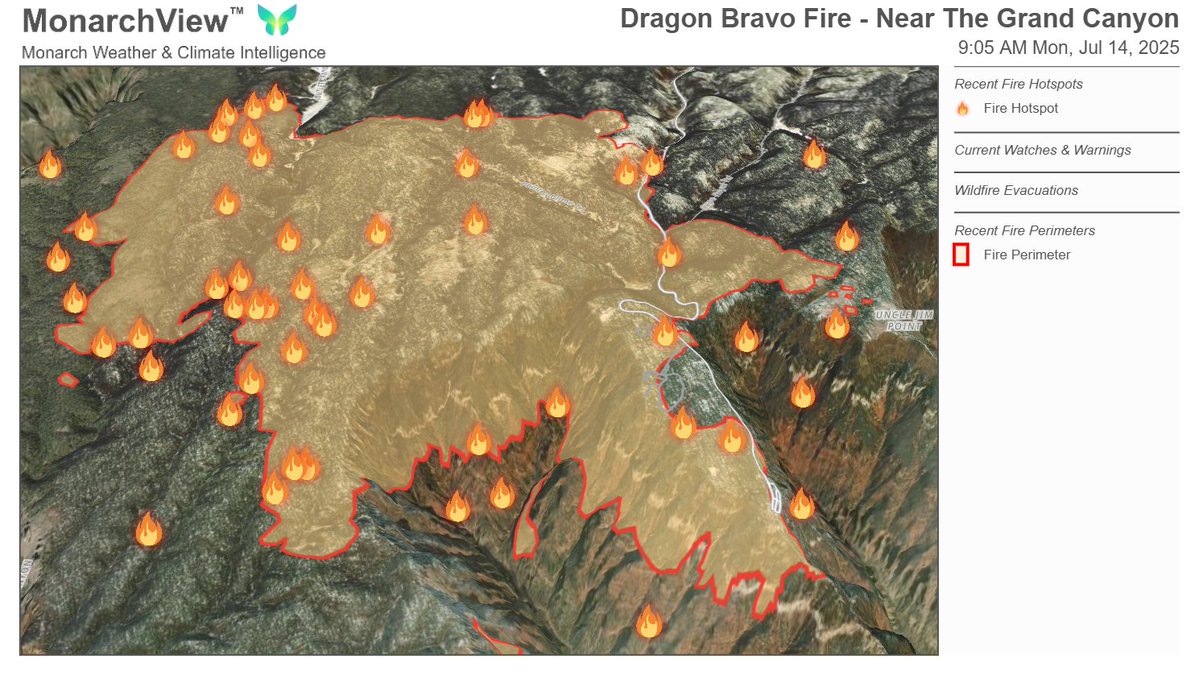
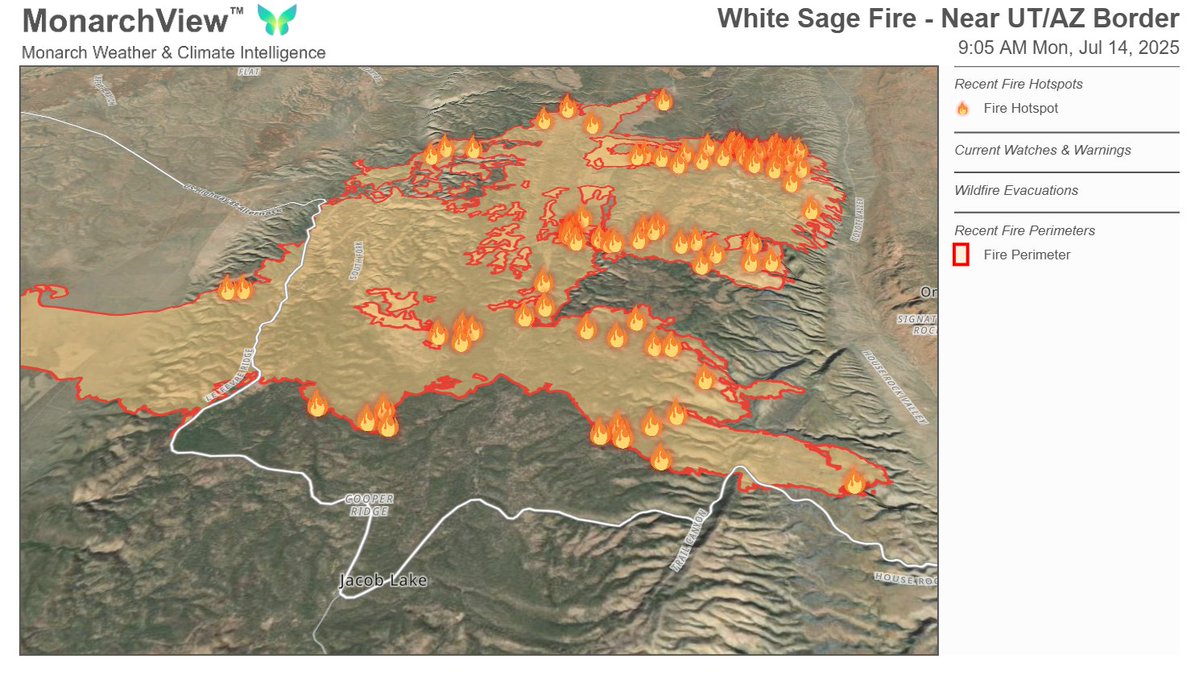
A detailed look at the northern Arizona #wildfires. 3D terrain, hotspots and fire perimeters plotted via MonarchView™
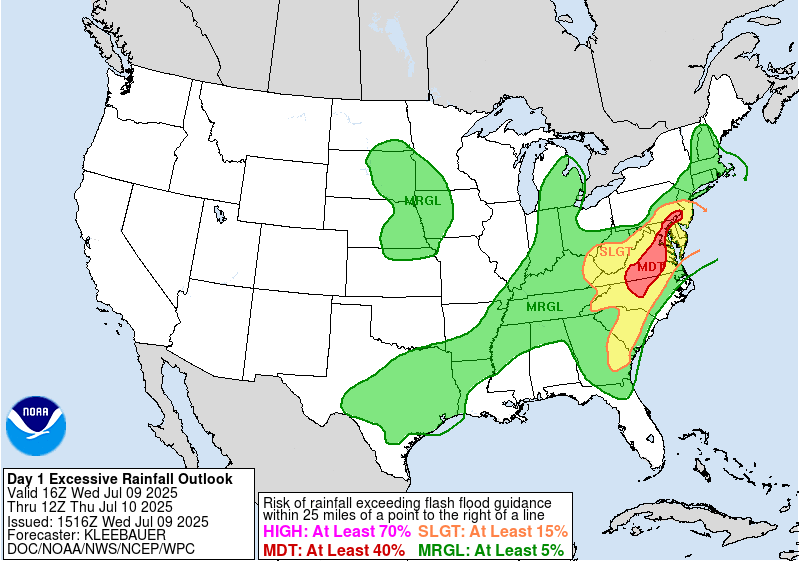
On average, LWX has issued 1-2 moderate risk rainfall outlooks a year. In the last month there has been four. In July alone, three. In the last week, two. Has been a very active pattern with some excessive rainfall every day risk since July 6. @capitalweather
Another day, another flood watch (it's a record-breaking 14th since May) for DC area. Storms with torrential rain most likely 5-10p tonight. We're in a level 3 out of 4 risk of flash flooding. Details at cwg.live
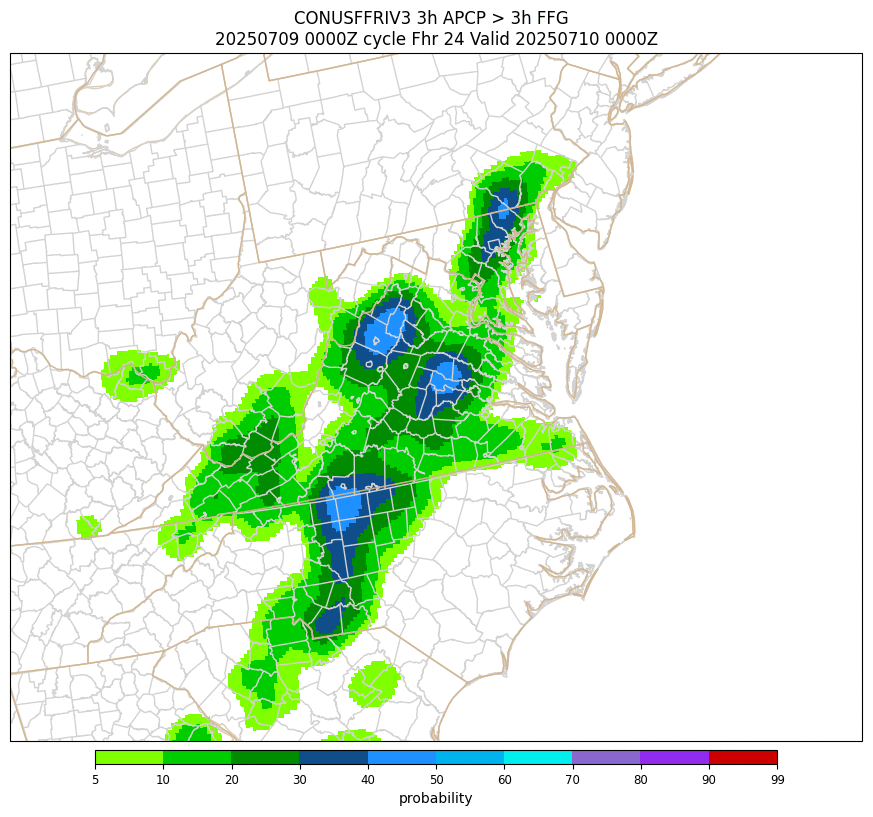
Big update by @NWSWPC extending the moderate risk for both north and south. Earlier HREF runs for probability of precipitation exceeding 3 hour flash flood guidance highlighting some hot spots like Greensboro-Chapel Hill-Durham and I-95 corridor D.C. to Baltimore up into…
Hourly rainfall rates are increasing across the board. via @ClimateCentral
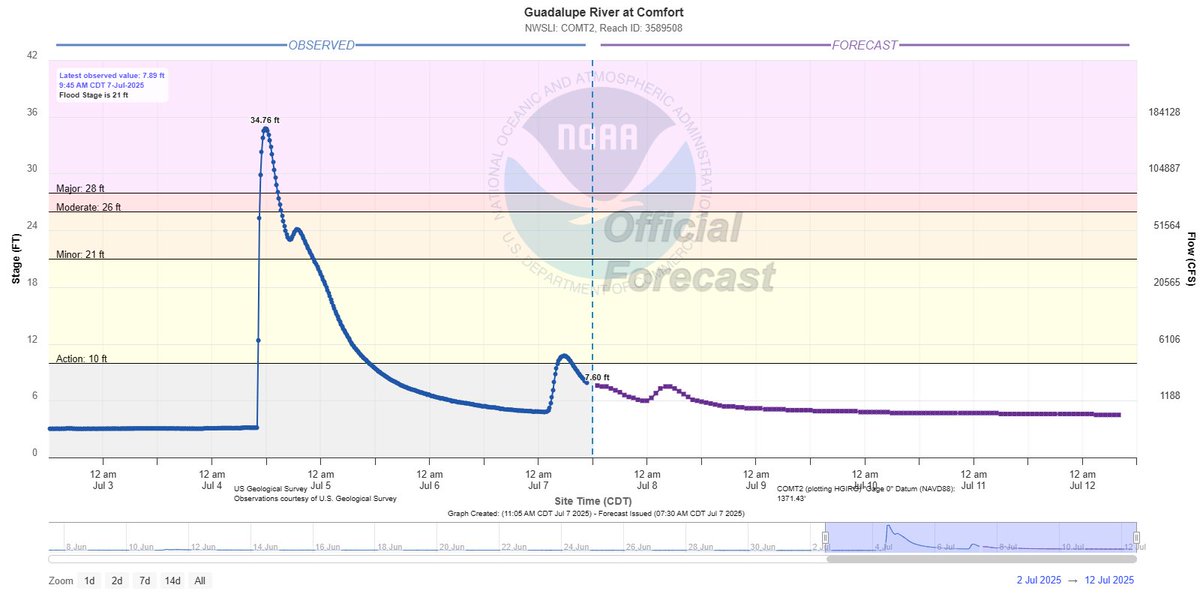
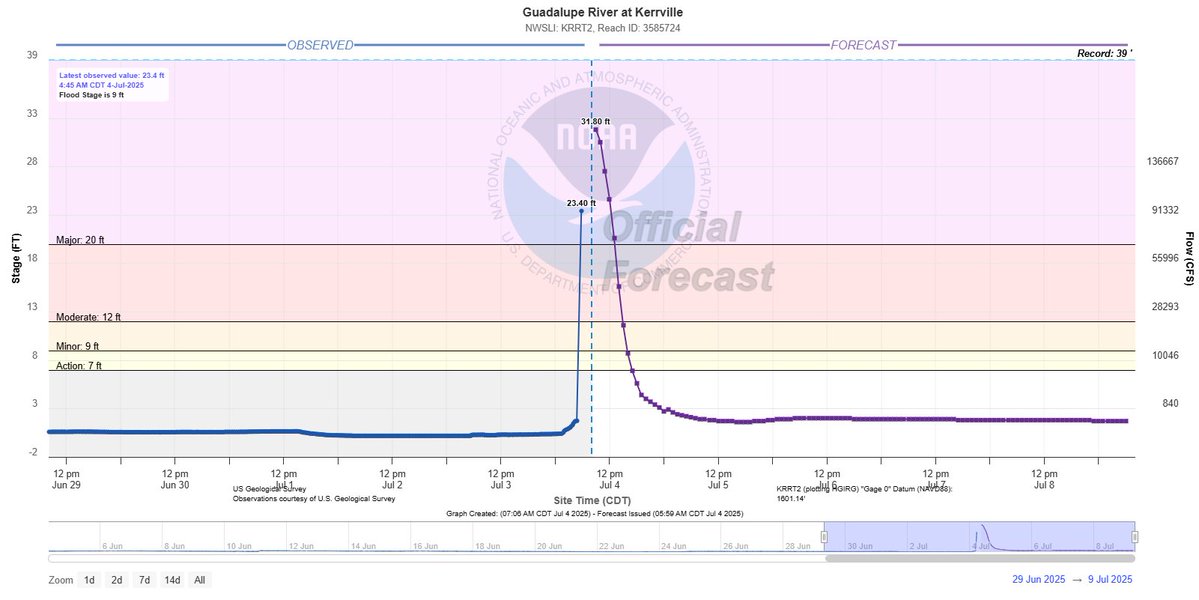
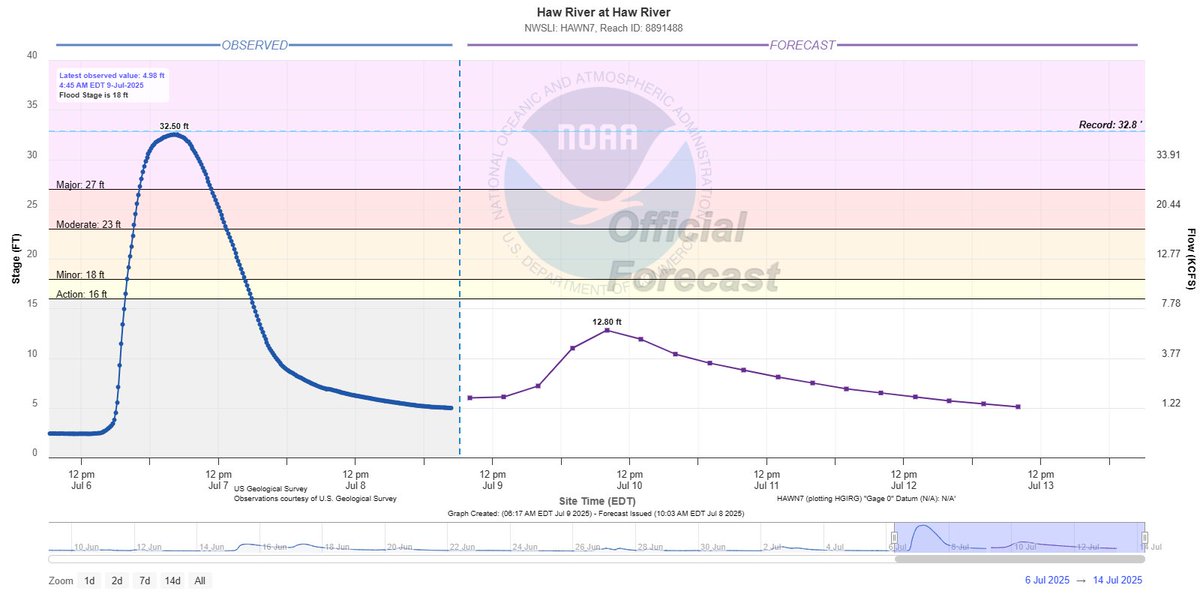
This past week, visualized through river gauges. All 1,000-year #flood events. #Chicago metro also had an extreme flood event last night too, but fortunately rivers are holding. *Hill Country, Texas *Chapel Hill, North Carolina *Ruidoso, New Mexico
This past week, visualized through river gauges. All 1,000-year #flood events. #Chicago metro also had an extreme flood event last night too, but fortunately rivers are holding. *Hill Country, Texas *Chapel Hill, North Carolina *Ruidoso, New Mexico
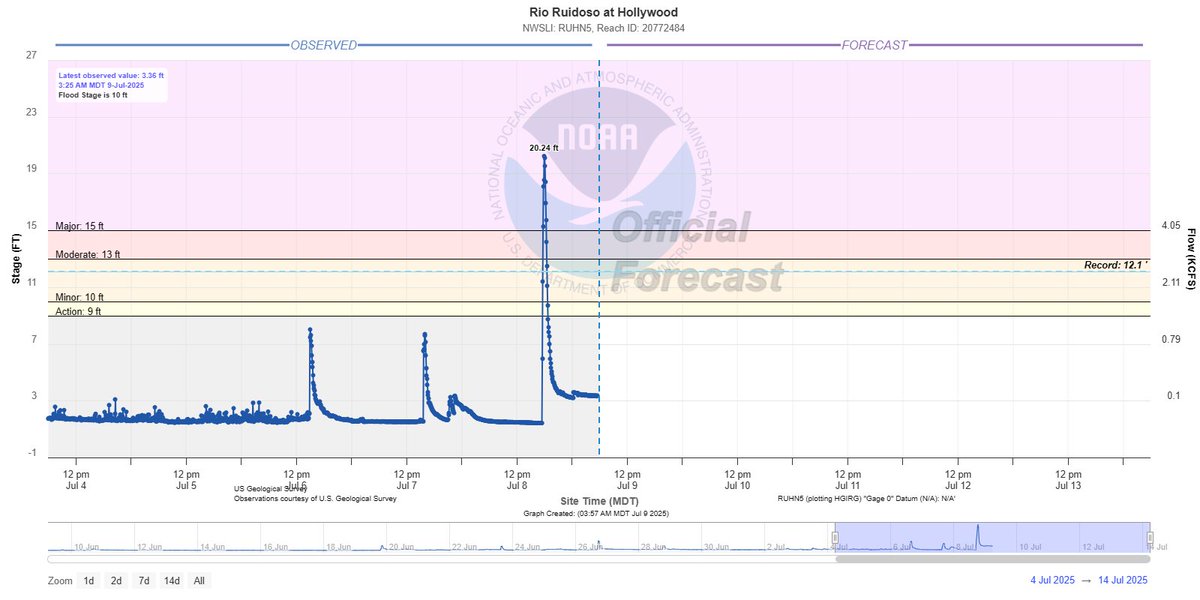
I've shared this map many times over the years, and unfortunately it still holds true. #FlashFloodAlley

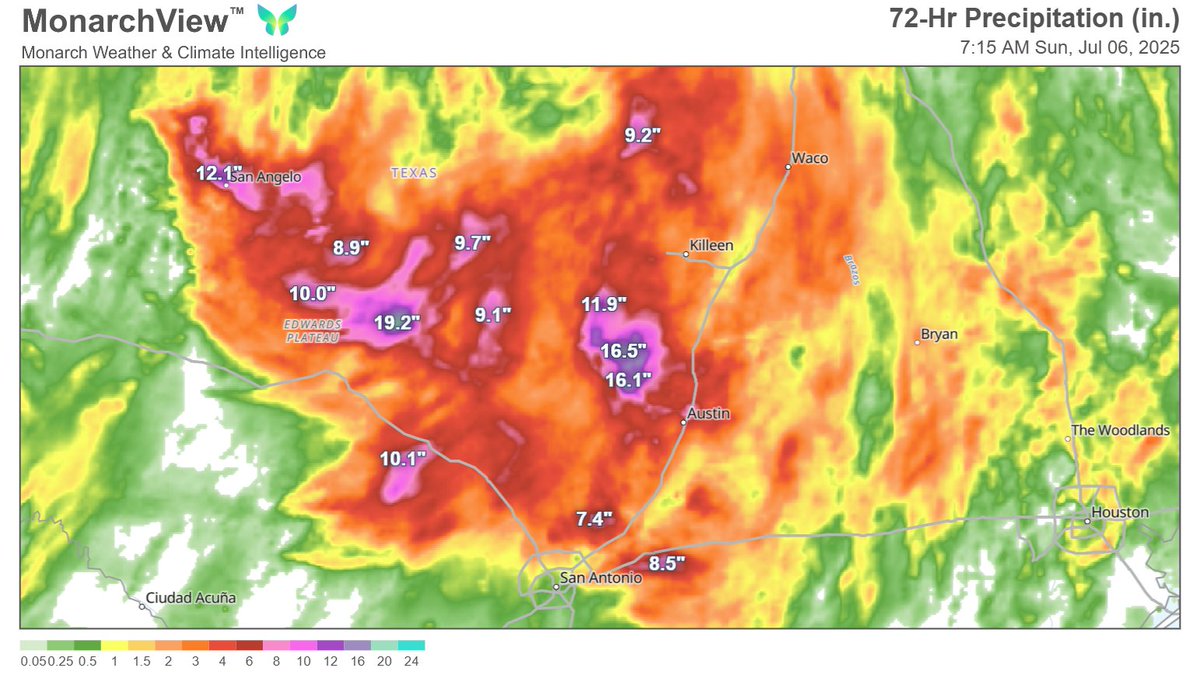
72-hour rainfall (radar estimates) across the Texas Hill Country really illustrates the highly localized, mesoscale nature to the locations of extreme rainfall and flash #flooding. #TXwx #FlashFloodAlley
Rainfall intensity has been trending upward near Austin. This shows the increase in hourly rainfall intensity. As the air warms it holds more moisture and has the potential to load storms with extra moisture and higher rain rates. GFX from @ClimateCentral
The heart breaking Texas flood is another example of a rain event, that statistically, happens once every 500-1000 years in this location. 15-20” of rain in 12-24 hours meets that threshold in this part of Texas. This estimate is limited by our historical record. And these rare…
A quick🧵about the devastating Texas flooding -- and how it connects to climate change. ⬇️ (Photo cred: @nytimes)
Excellent recap and discussion from @mattlanza. The meteorological, geographical and psychological factors behind the ongoing #Texas #flooding.
This was a tough one to write about. But people are owed an understanding of the meteorology behind a tragedy. As well as knowing facts vs fiction.
How predictable was the severity of the Texas floods? Hours before the worst of the rain fell across Texas early Friday, a forecast from ECMWF (00 UTC, July 4) sounded the alarm. That model run predicted record-breaking precipitable water, or total atmospheric moisture, across…
Flooding in Texas was linked to the convergence of two tropical moisture plumes, one from the eastern Pacific & another from the Gulf. This produced near-record high atmospheric moisture. Global precipitable water levels have been running 3rd-highest on record in recent months.
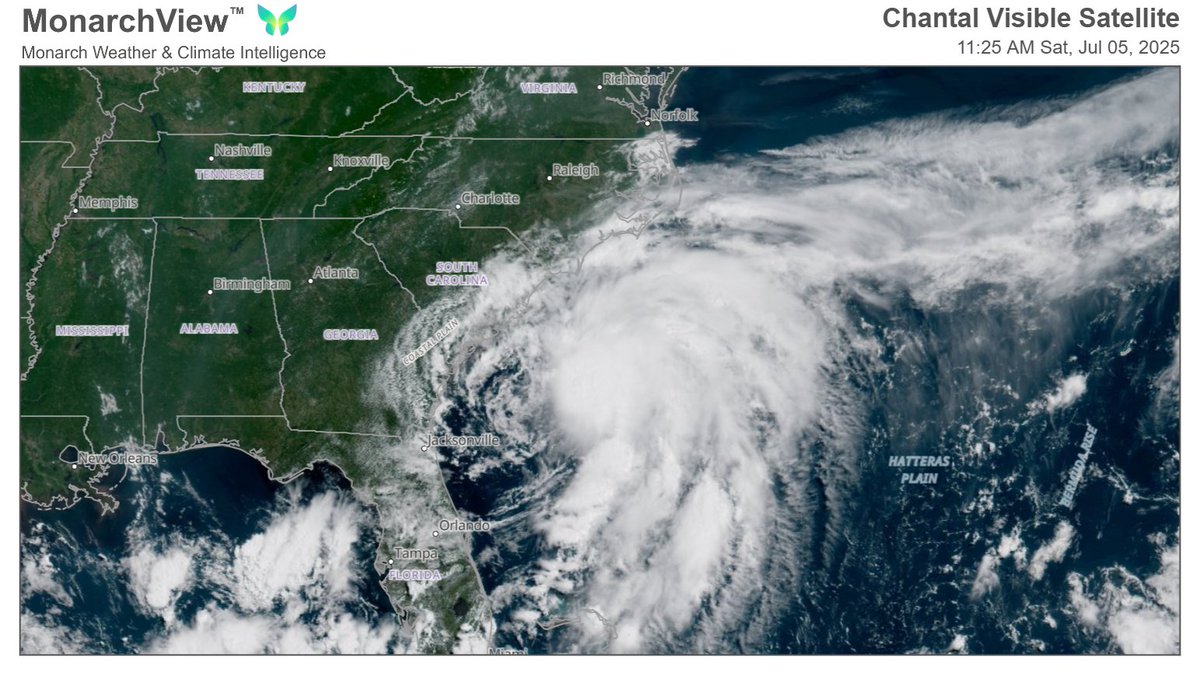
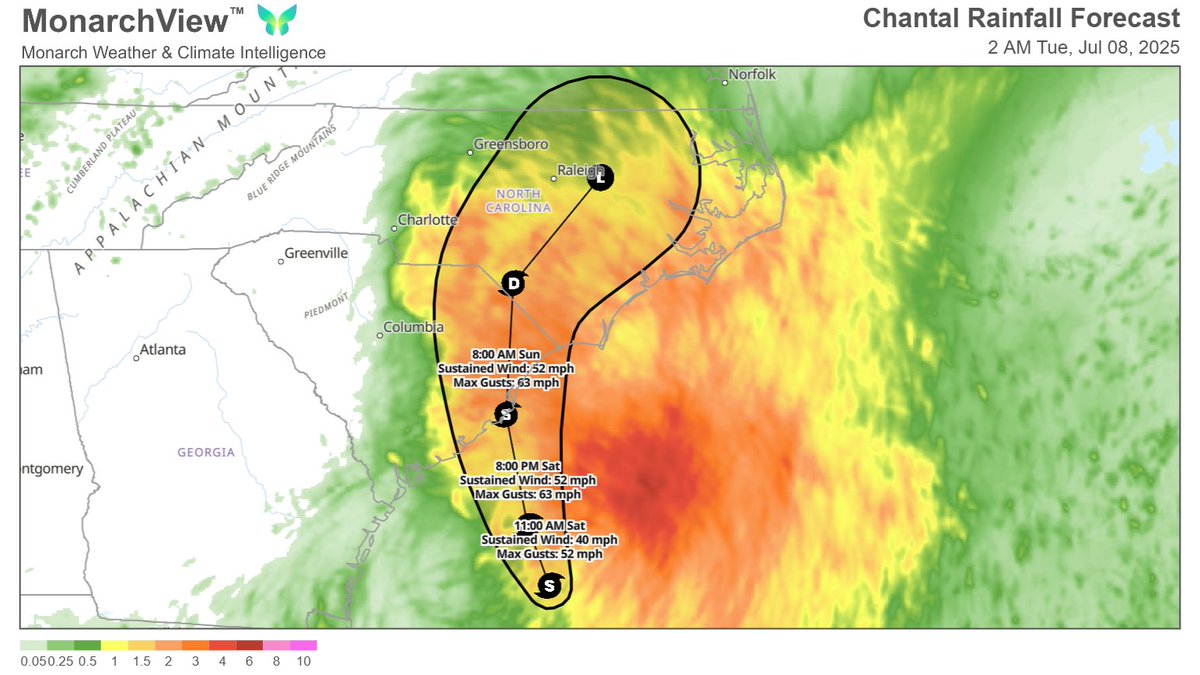
We will have our first landfalling tropical system of 2025 by the end of the holiday weekend. Tropical Storm #Chantal is asymmetrical and lopsided, with the heaviest rain east of the center. Images courtesy of @monarchweather's MonarchView™ 🦋
For what it’s worth, the sort of SSTA pattern that persistent +NAO yields (warmth south of the Canadian Maritimes with cool waters in the east/southeast Atlantic) is fairly similar to the sort of pattern that favors Octobers that produce more ACE than August. Something to watch.
While the tropical Atlantic has warmed some, the subtropics have warmed even moreso in response to an ongoing period of +NAO. With modeling showing the +NAO continuing if not strengthening, this pattern may continue to amplify north of the tropics, cooling the eastern Atlantic.