nimishtrading
@nimishtrading
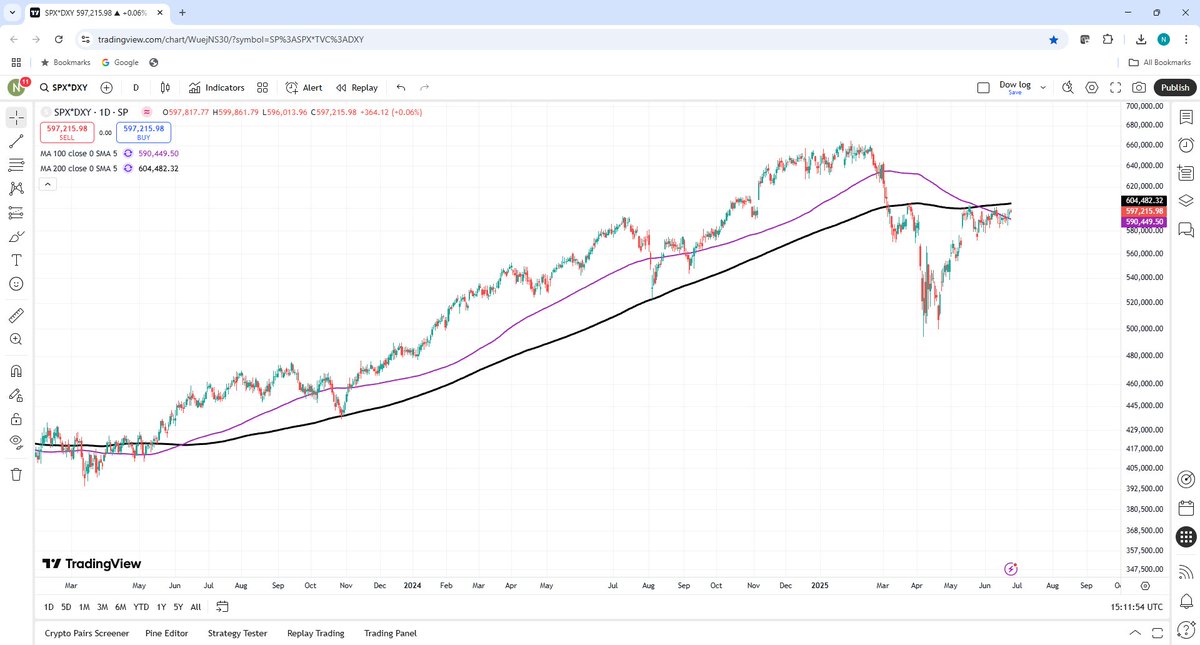
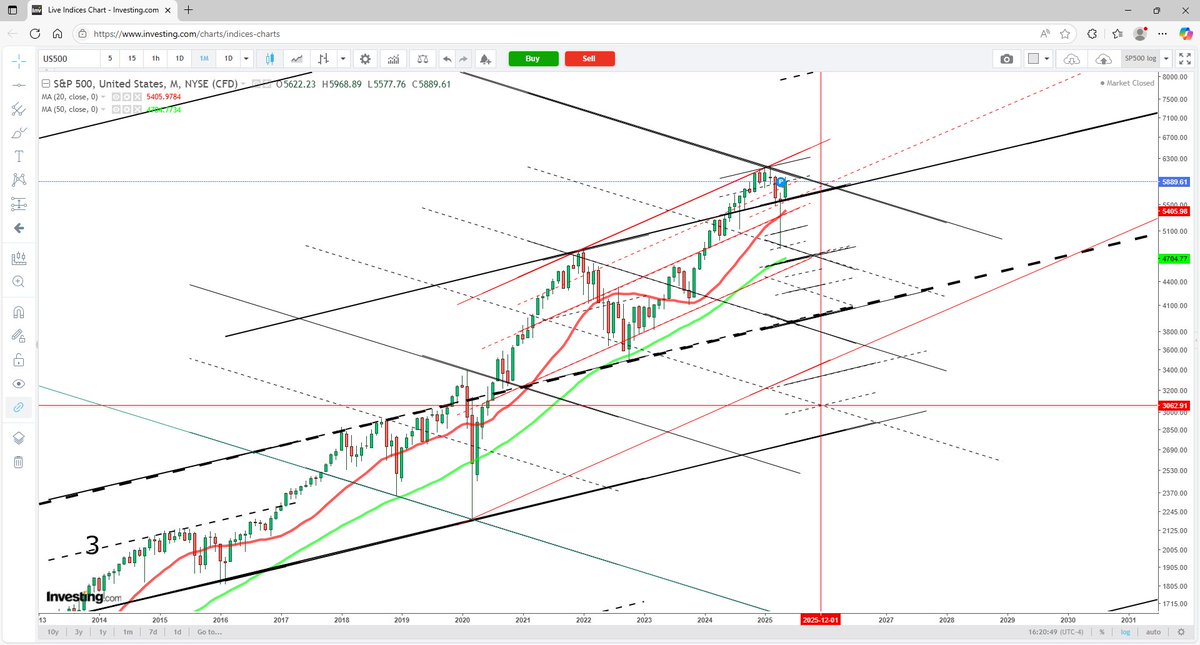
Parallel channels with mid-channel lines on the logarithmic chart with fibonacci. That's all you need to know.
I'm looking for a last sharp pullback here the next couple of weeks that sets up a new ATH in July for $SPX $QQQ. Running on some fumes here into obvious resistance, I think we fall short of tapping the ATH on this first go. 200 period MA on the 2hr chart coincides perfectly…
$SPX - This is a blow off top now. The TSI closed above 42. This is the 3rd time that happened in the last 5 years. The other cases topped at 51 in Sep 2020, 51 in Dec 2023 and 49 in Jul 2024. Dec 2023 isn't comparable. The 2020 and 2024 cases were followed by 10% corrections.
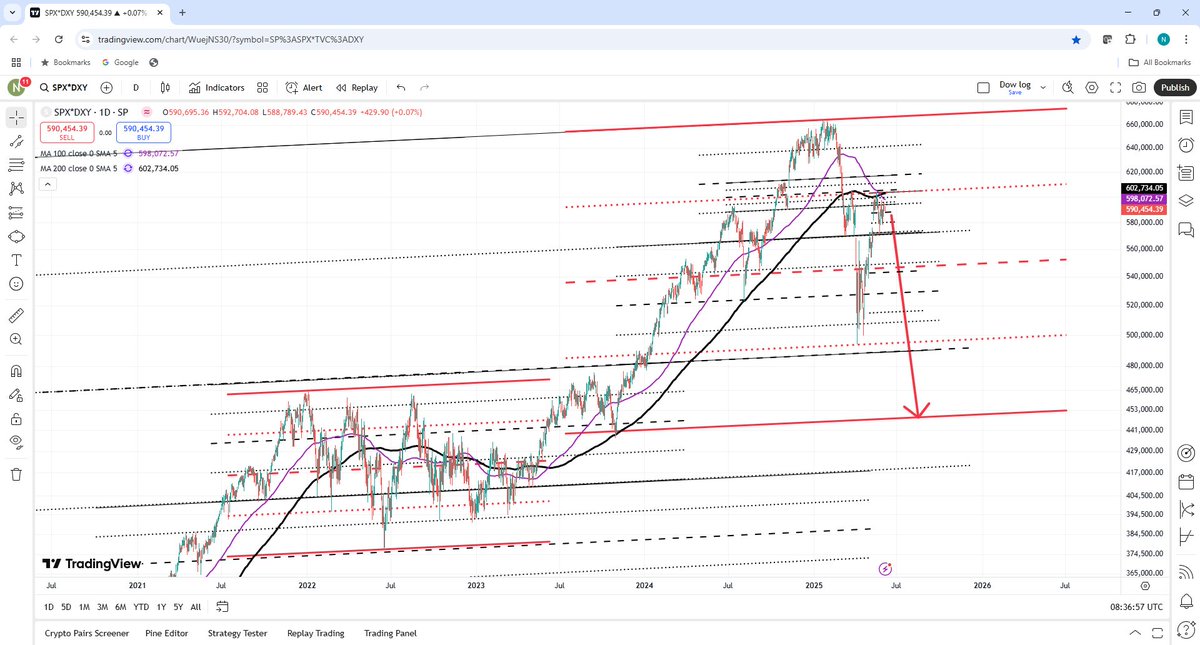
Alternative lower target. Come to think of it, this looks a more fitting pattern....top of channel 2 then back down to bottom of channel 2.
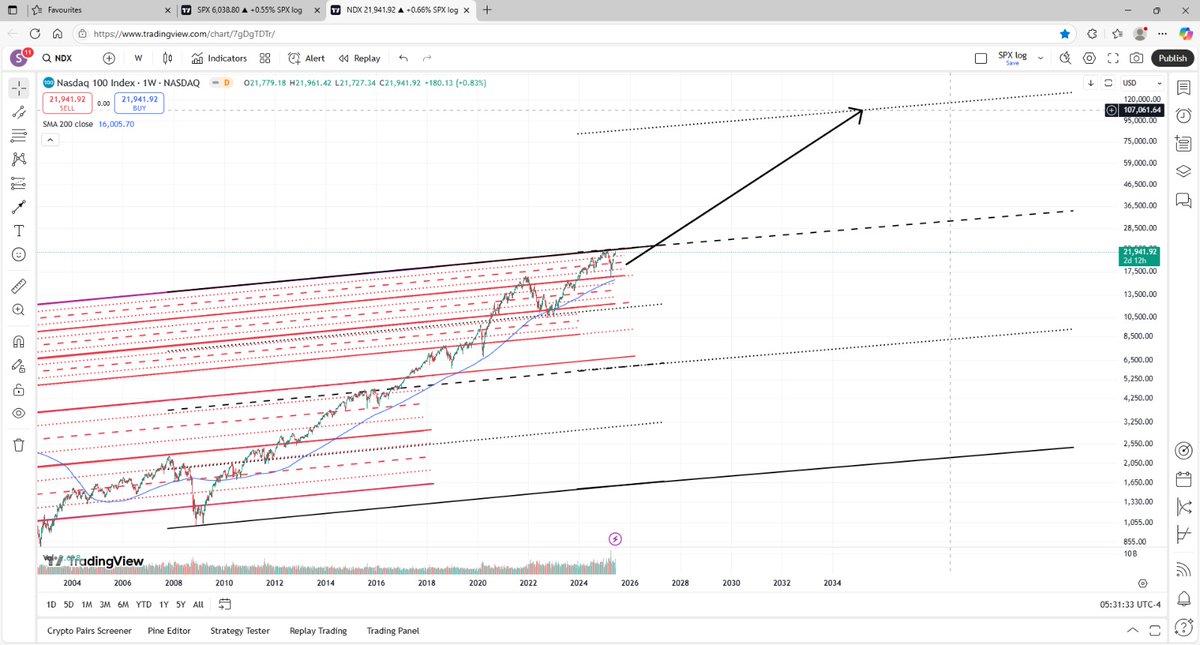
SP500 - Can get to 6450 by August. Then dip to 5660 in Sept.. If this pattern is correct then it gets to the top of the blue channel no. 4 in the 13,000s in 5 years.
The Third Year of a Bull Market is Choppy The chart presents average price action in the S&P500 compared with the current bull market. Bull market is defined as a 20% bounce from a bear market bottom. Bear market is defined as a 20% or deeper correction. Data since 1949 $SPY…
NASDAQ - If it gets above the black channel line, then it trades in the next big range up to the target seen.
This will be the first Daily Close below Pivot. Also, the Daily Signal will turn down tomorrow unless the market gets back above Pivot (Stack: Fri/Mon was the earliest could turn down). Pivot is currently $SPX 5,970. Everything depends on tomorrow.
If this followed the same pattern as 2022 - See 4 red channel widths.
The definition of a Sell Signal is as follows: 1) Daily Signal turned down 2) Daily Close below Pivot We have not yet seen that.
x.com/datruthbomb/st…
SPY vs USDJPY updated! 👀👀
USDJPY as a leading indicator for SPY. This is a longer-term view compared to the previous post. While not perfect, it’s equally intriguing. The key difference is that the next short-term top appears to be around mid-June, followed by a major top marking the end of the rally…