Karim Douïeb
@karim_douieb
🦋 https://bsky.app/profile/karimdouieb.bsky.social 🔗 https://www.instagram.com/karim_douieb
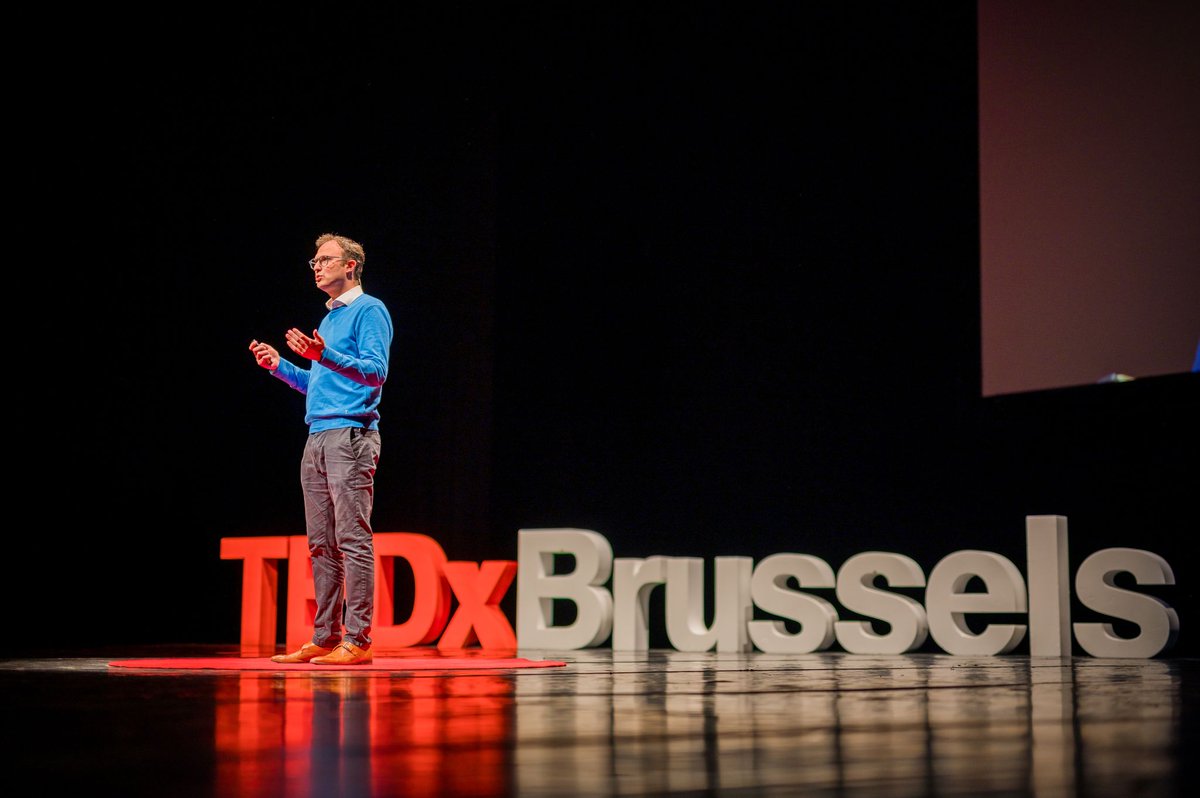
La beauté des données pour changer le monde✨🌍 Mon @TEDxBrussels talk est en ligne! 👉 youtube.com/watch?v=xOqewt… Découvrez comment la visualisation de données brise les préjugés, inspire de nouvelles idées et crée une société plus inclusive. #DataActivism #TEDxTalk #Brussels
📈 Can Belgium reach 80% employment by 2030? We created an interactive visual storytelling piece showing how age, gender, and location shape job opportunities. Take a look 👉 …80.s3-website-eu-west-1.amazonaws.com/?lang=en
Hey #dataviz folks! I’m looking for fun, hands-on workshop ideas to introduce art students (no coding skills) to data visualization. Any favorite exercises that blend creativity & data in an engaging way? Open to all suggestions! 🎨📊
Another fantastic roundup of datavis! Thrilled to see my wild creations making an appearance! 👀
A tragic plane crash, a turnaround for Barnes & Noble, and political drama in Germany — find these and more covered in our Data Vis Dispatch this week 📈 ➡️ blog.datawrapper.de/data-vis-dispa…
Learn why and how @karim_douieb (data scientist and co-founder of Jetpack.ai) used Observable to re-envision U.S. election maps using a dynamic cartogram, for a more intuitive, representative, and engaging view of election results: buff.ly/41P9vZg
Thanks Philip for including my little dataviz experiment in the latest edition of "How to read this chart" newsletter. 🙏 Subscribe for your weekly dose of data insights and creative visuals.
Lots of good stuff in the (free to read) newsletter, including not one but two interactive tools to appeal to your vanity. s2.washingtonpost.com/camp-rw/?track…
Animation in dataviz has been my secret recipe—not just to help people understand my charts but to make them fun, engaging, and impactful. It’s often overlooked, yet easy with D3 transitions and super powerful. Thrilled my U.S. election map is featured in this must-read article!
Animation can be a gimmicky distraction in data visualization. But when used with care, animation can improve user experiences and help viewers track patterns across charts and metrics. We share five ways you can use animation for more effective data viz: buff.ly/3ZDT3tp
They say every true ceramist must make a porcelain teapot to earn their stripes... So, does this count? 🫖 #porcelain #teapot #ceramics #pottery #projection #shadow
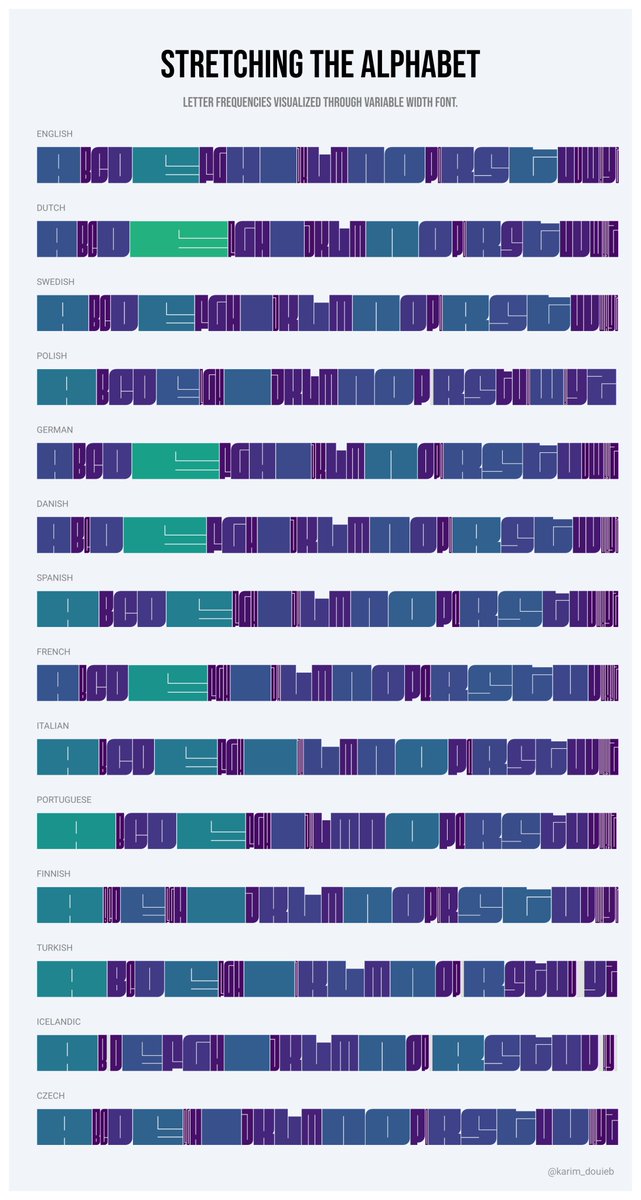
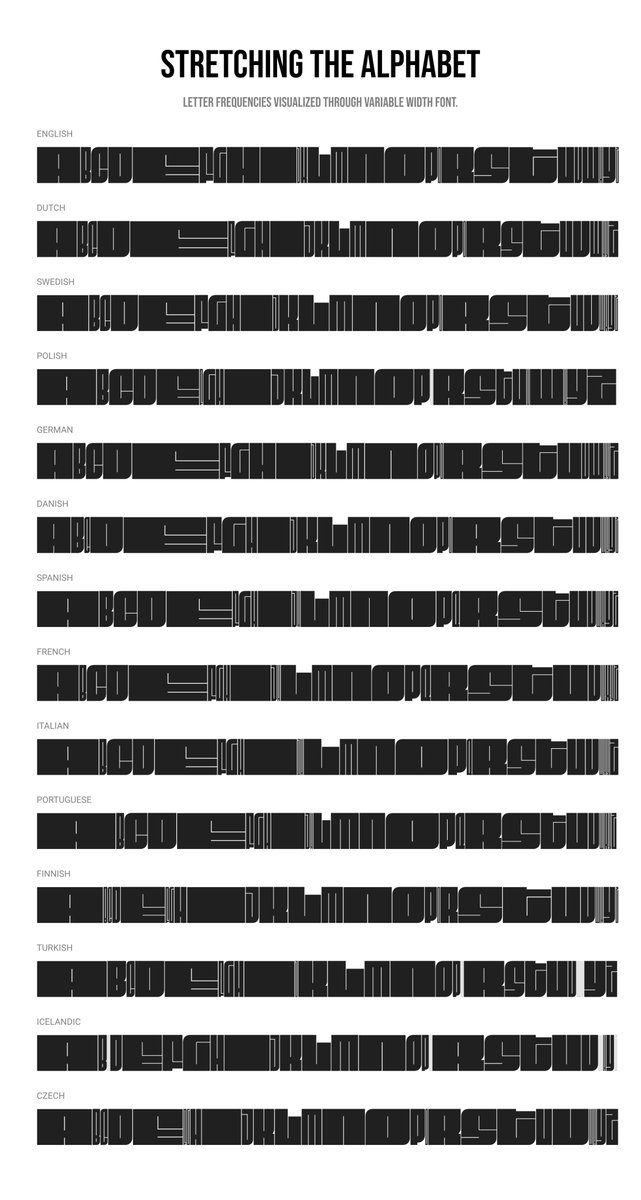
Here’s a new dataviz experiment: exploring letter frequencies in different languages using variable fonts. The width of each letter stretches with its usage frequency. Not sure how I feel about the result—kind of cool, kind of meh. 🤔 What do you think? #dataviz #experiments
Here are the all-time most popular baby names in the US (male & female)! 👶 Each letter's height shows how trendy the name was over time. 📈✨ Check for yourself and search your name 👉 baby-names.jetpack.ai
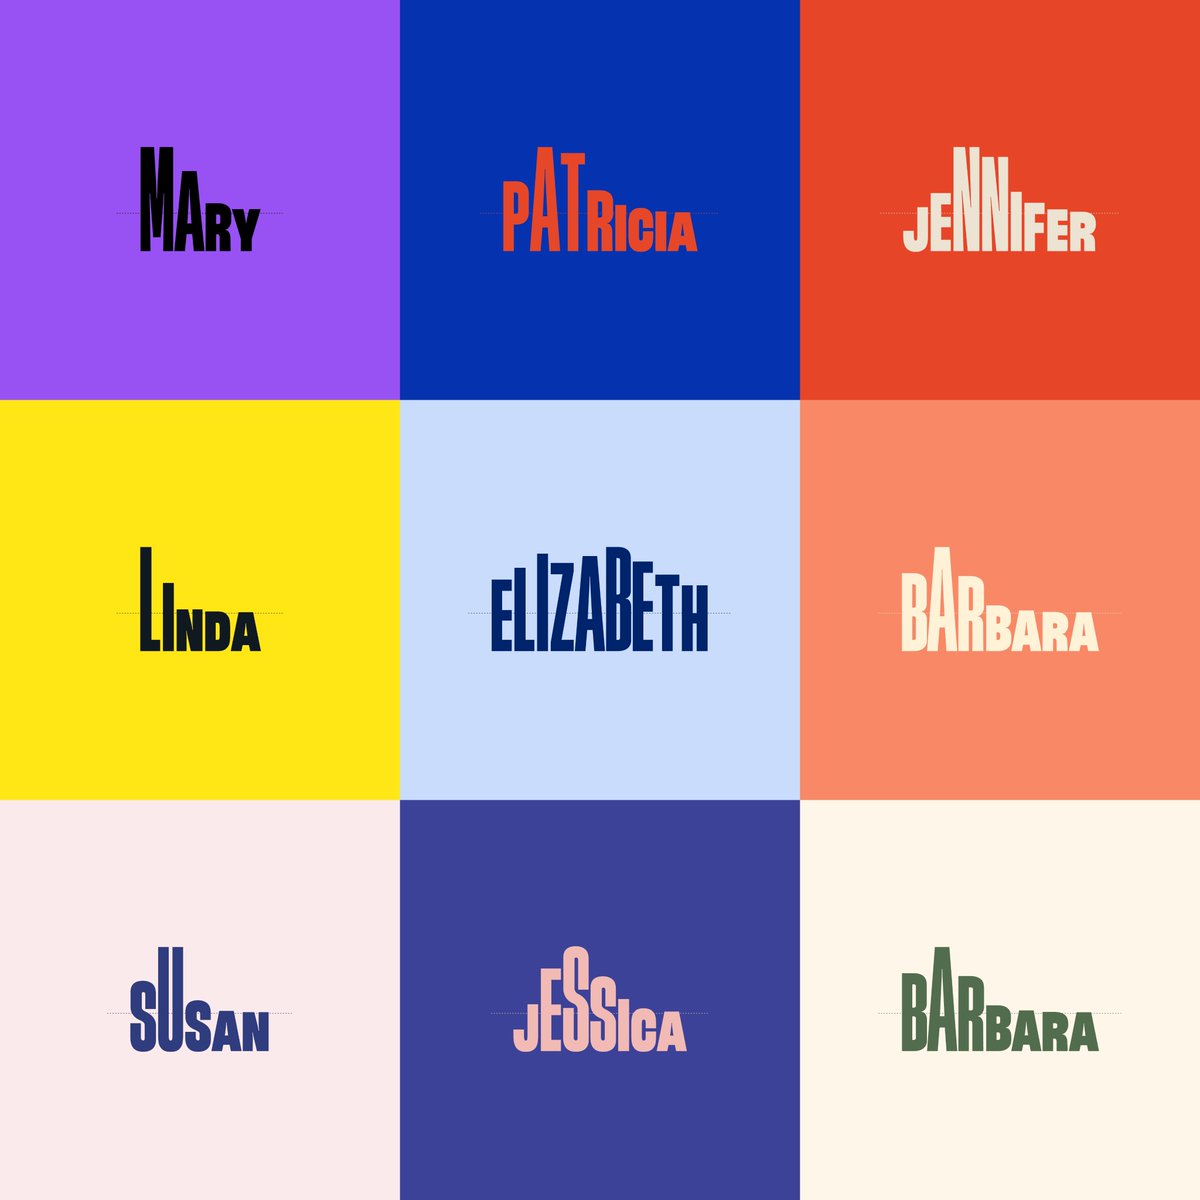
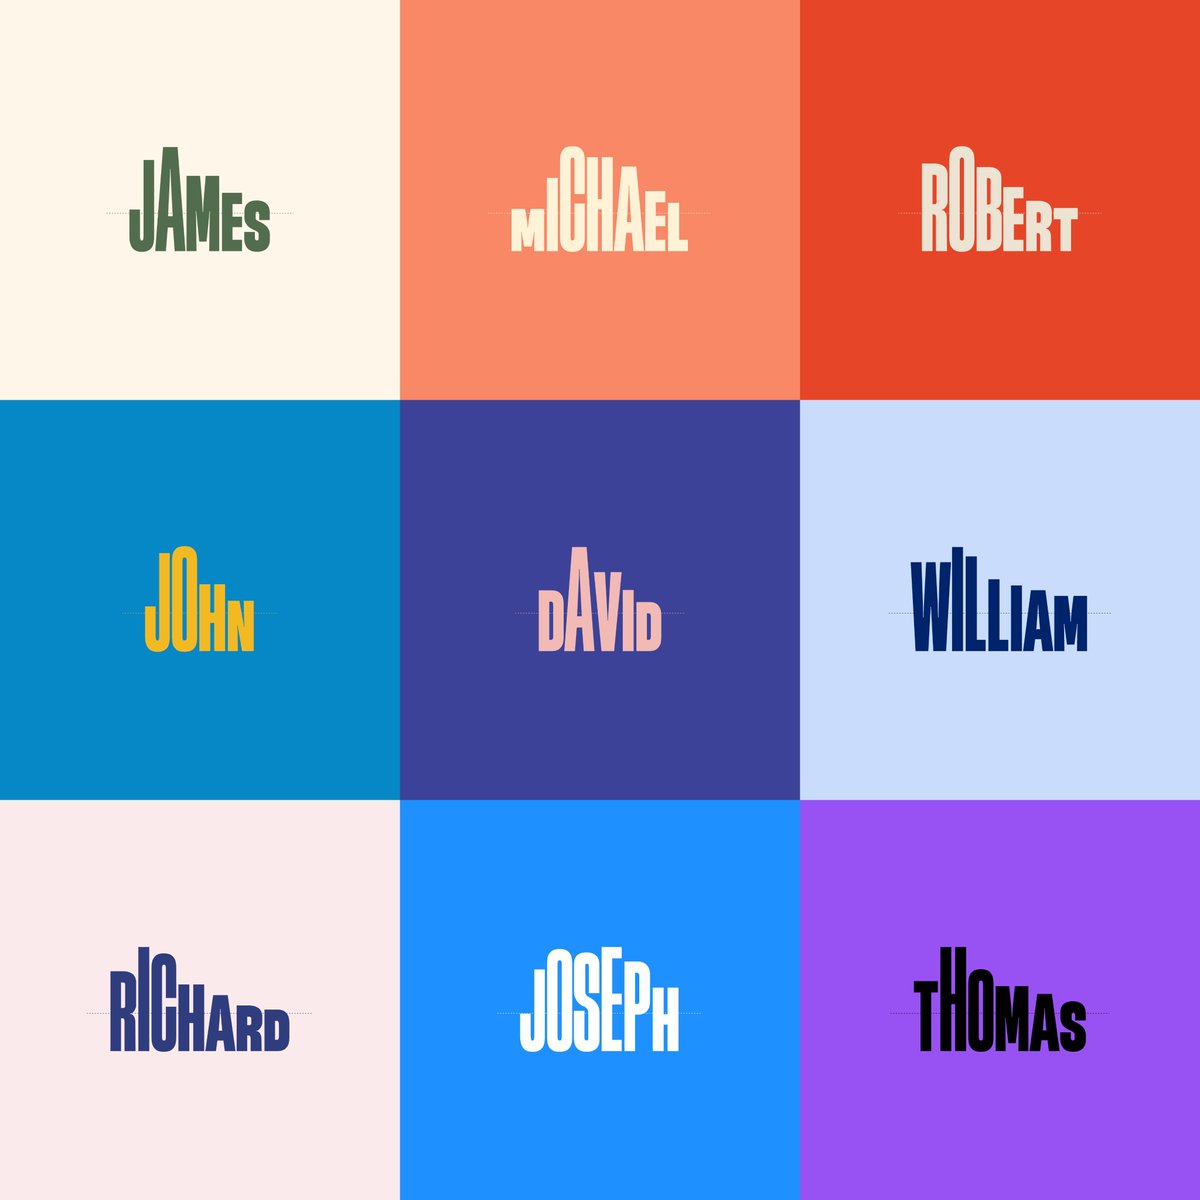
I built a fun little app to explore baby name trends over time! 👶📈 Type your name, watch its popularity evolve, and create a unique visual. Give it a try and let me know what you think! 👉baby-names.jetpack.ai #BabyNames #DataViz #typography
Honored to see my election map featured in @FastCompany with "This shapeshifting map shows how big Trump’s 2024 win really is." Huge thanks to Mark Wilson @ctrlzee for spotlighting this approach to visualizing election results—thrilled to see it resonate!👉fastcompany.com/91224561/how-b…
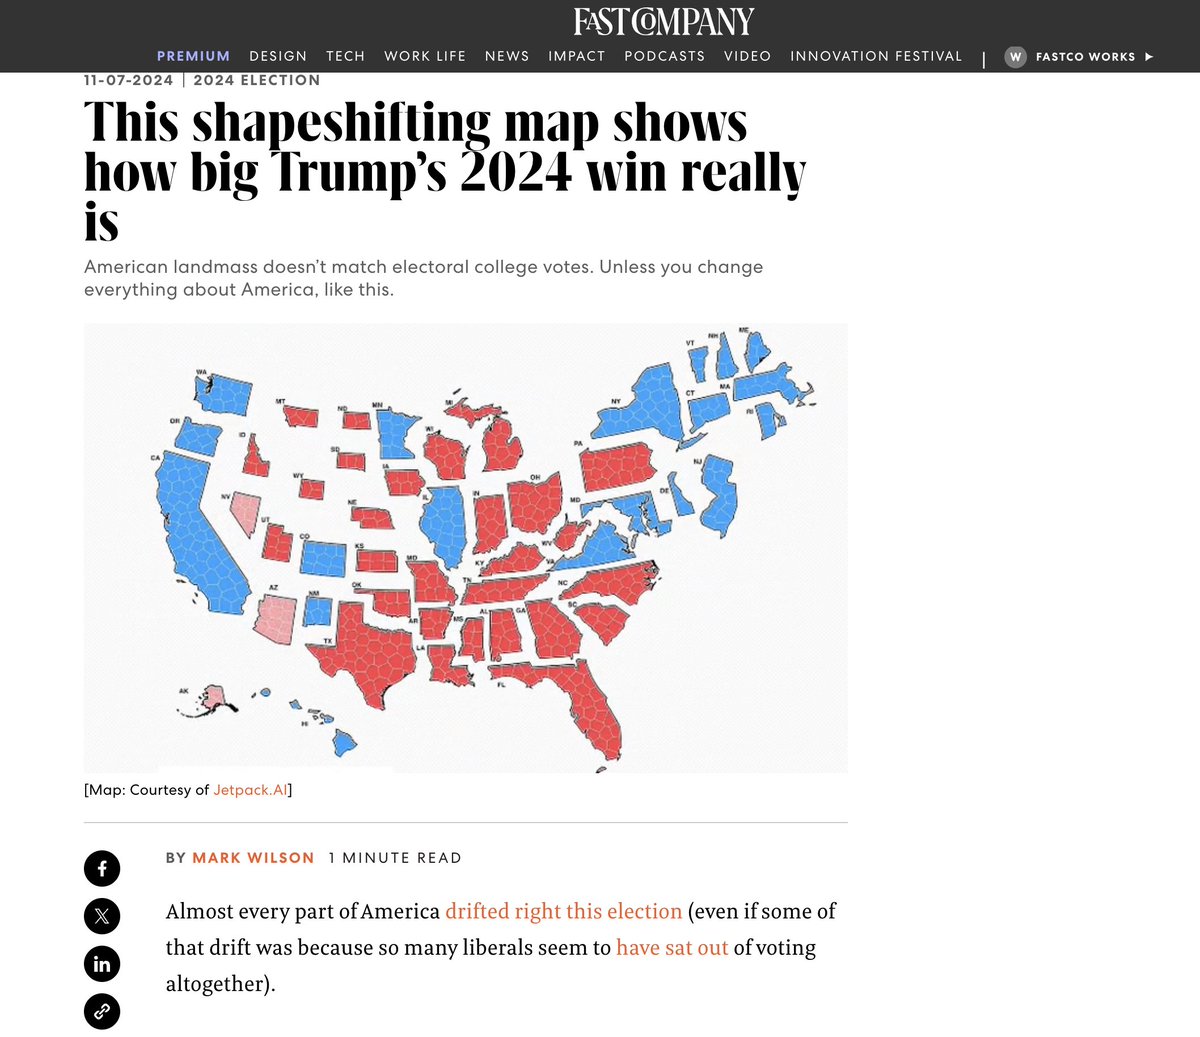
For what it’s worth: an alternative view on the 2024 U.S. Election Map 🗳️ This map scales states by electoral weight, preserving the U.S. shape for recognition. Voronoi-based shapes within each state show exact elector counts. #Election2024 #DataViz #Cartogram #ElectoralCollege
Yesterday's BC Election remains to close to call for several ridings and the overall balance of power, but I decided to do a quick land-vs-people vote animation anyway. (Cross-posting with one day delay from the other site where the air is cleaner and skies are bluer.)
🚴♂️ My kid tried the bikes at the #ILoveScienceFestival, and they were wild! 😵💫 #ILoveScience #FamilyFun @visitbrussels