Datawrapper
@Datawrapper
Enrich your stories with charts, maps, and tables – interactive, responsive, and on brand. Questions? Write us: [email protected]
If you like stunning visualizations, then you'll certainly enjoy "CHART" by @NadiehBremer! You’ll find yourself flipping through every page, stopping to admire the designs again and again. 📚 We'll discuss it on August 18th here: notes.dw.tools/p/chart…
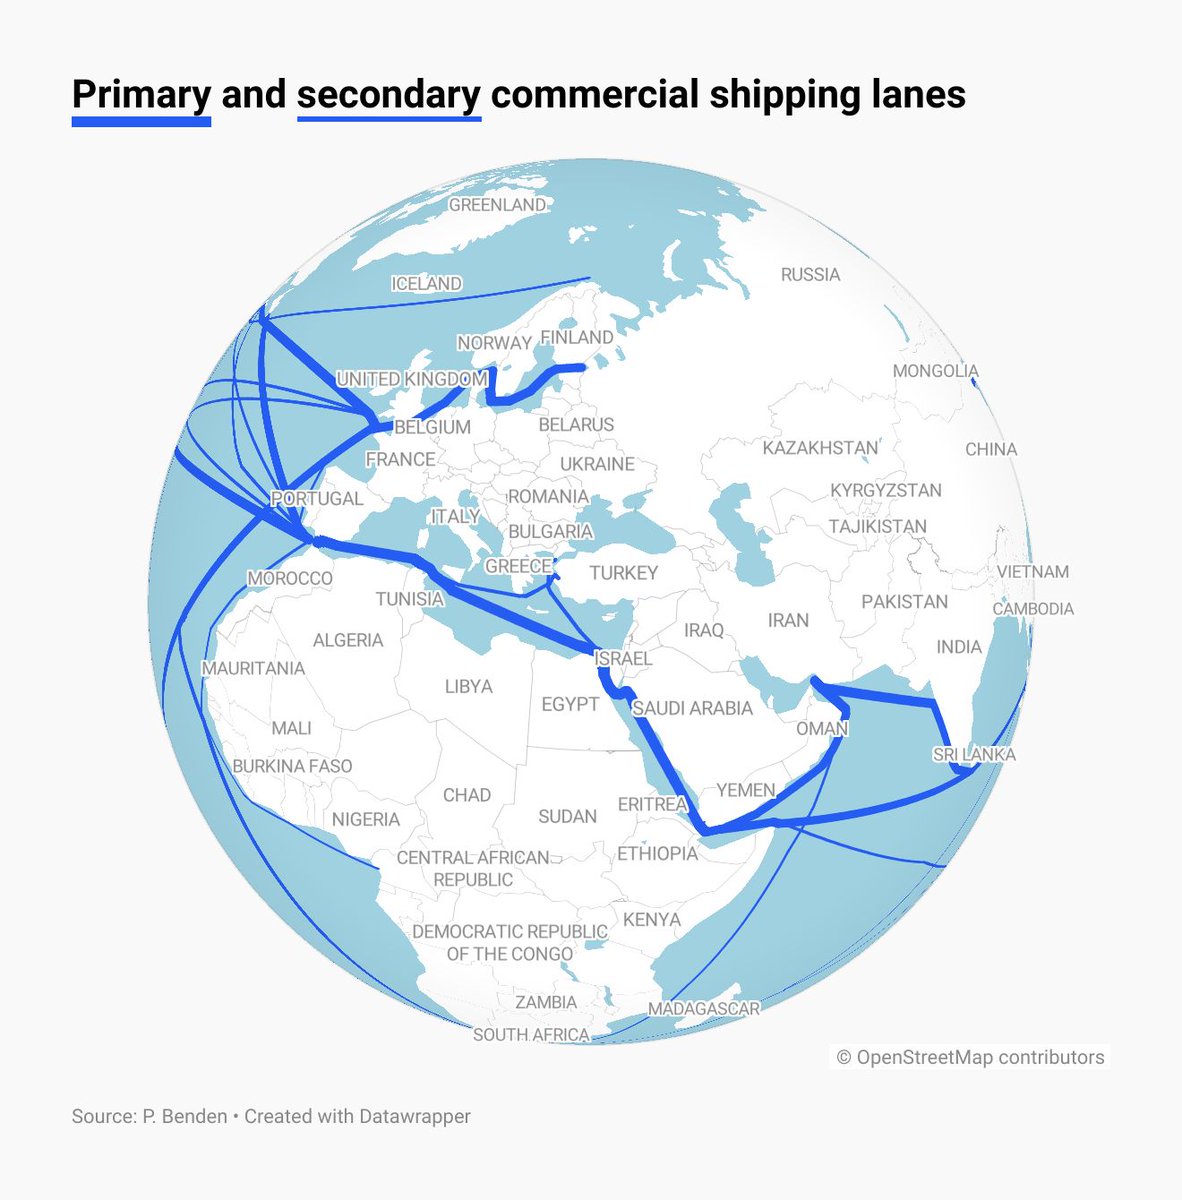
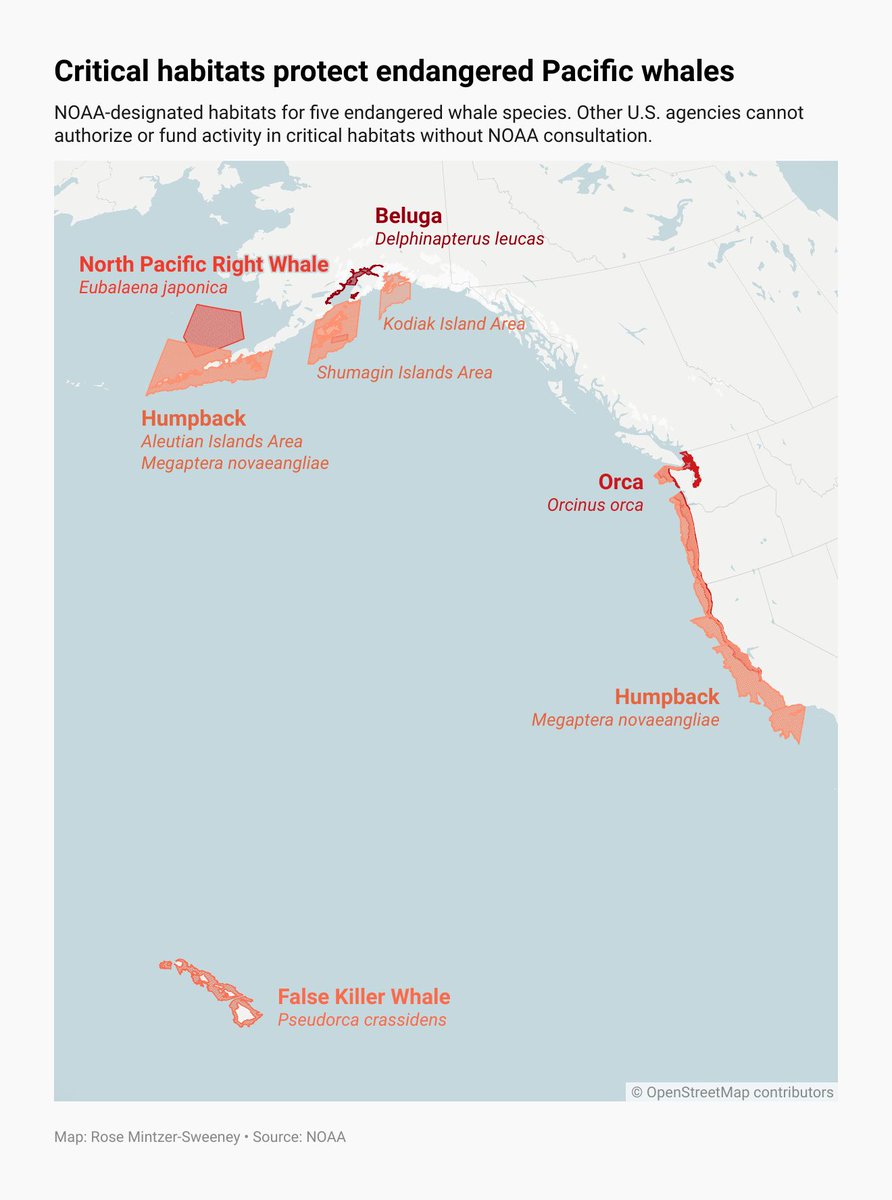
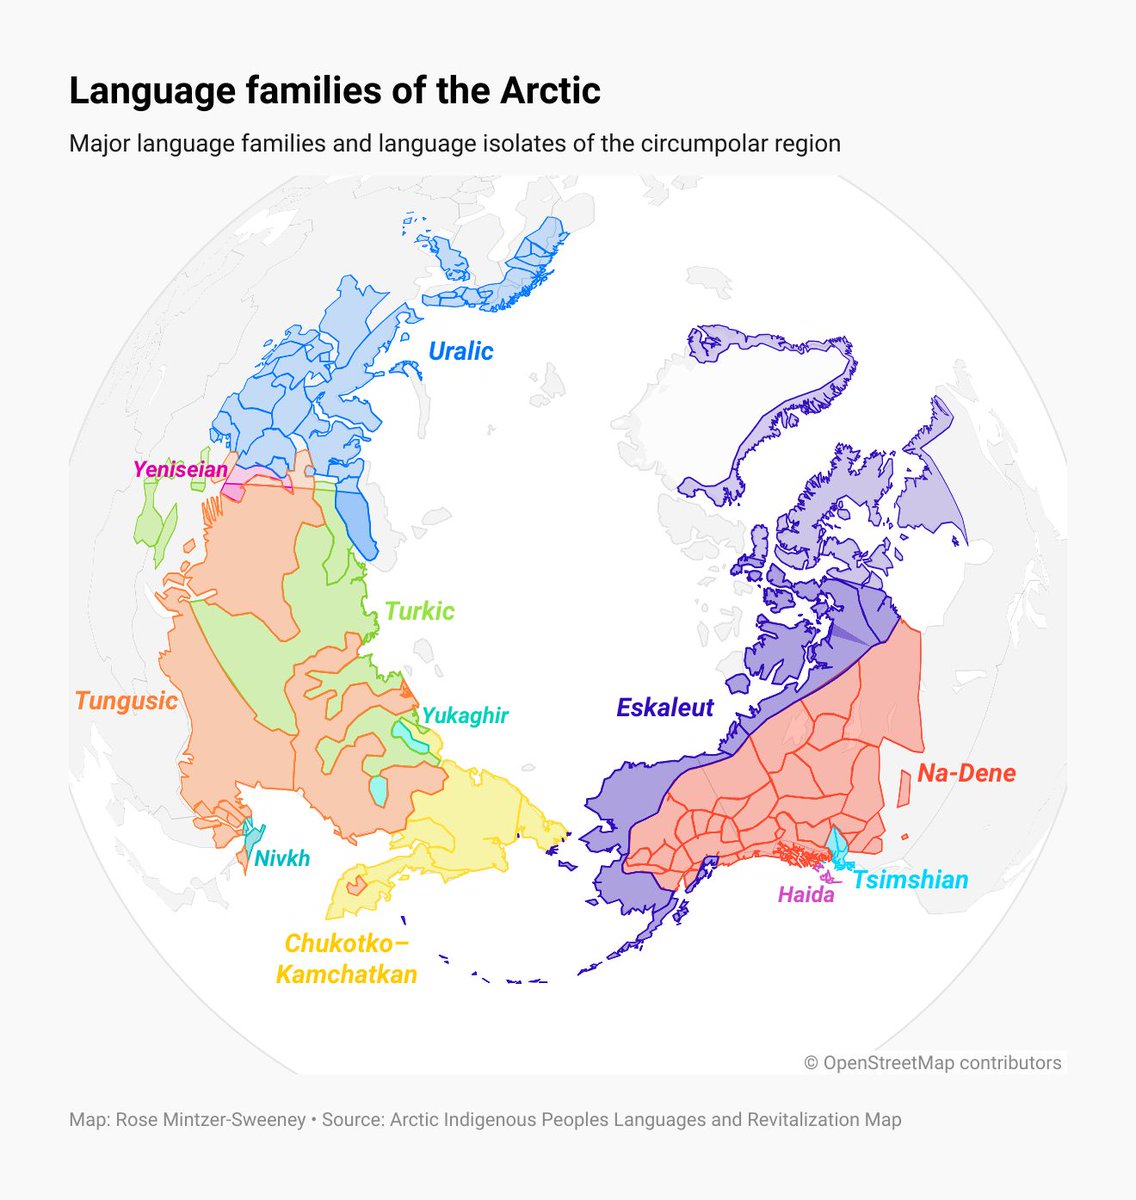
🎉 New: If you're mapping the North Pole or a long-haul flight path, then it matters to you that the Earth is a sphere — not the flat rectangle of traditional Mercator projections 🌏 We hope our new globe projection expands your locator map horizons! datawrapper.de/blog/new-globe…

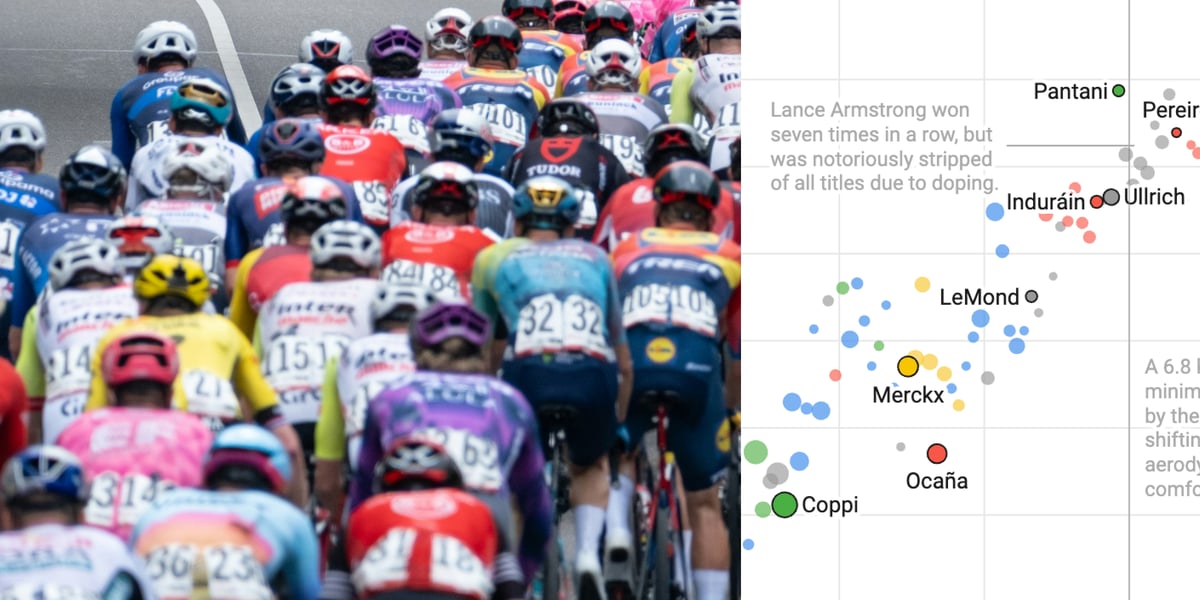
Whether you're a long-term fan or wondering what the hype is all about, Jonathan's Weekly Chart might give you a new perspective of the famous Tour de France, about to reach its finish line this Sunday. 🏆 🏁 🚴♂️ datawrapper.de/blog/the-evolu…
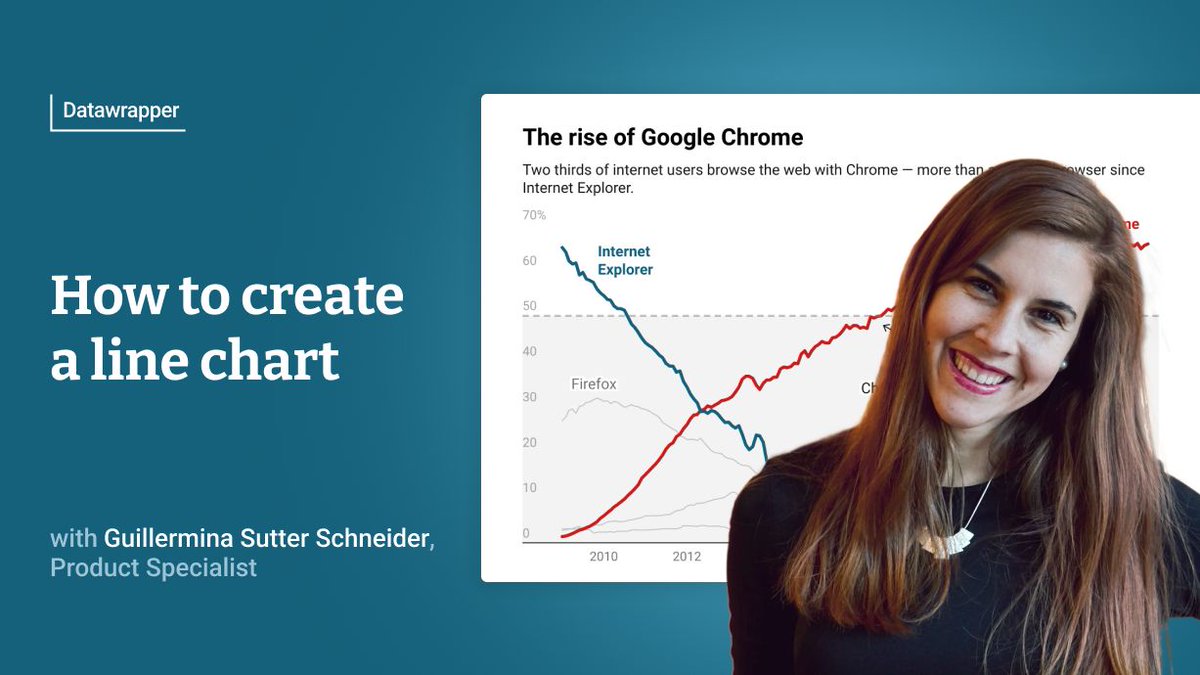
📈 A good line chart tells a story. In this video, you'll learn how to create one from scratch using Datawrapper—no code needed. 🎥 Watch it here: youtu.be/kKhAta1hxVo
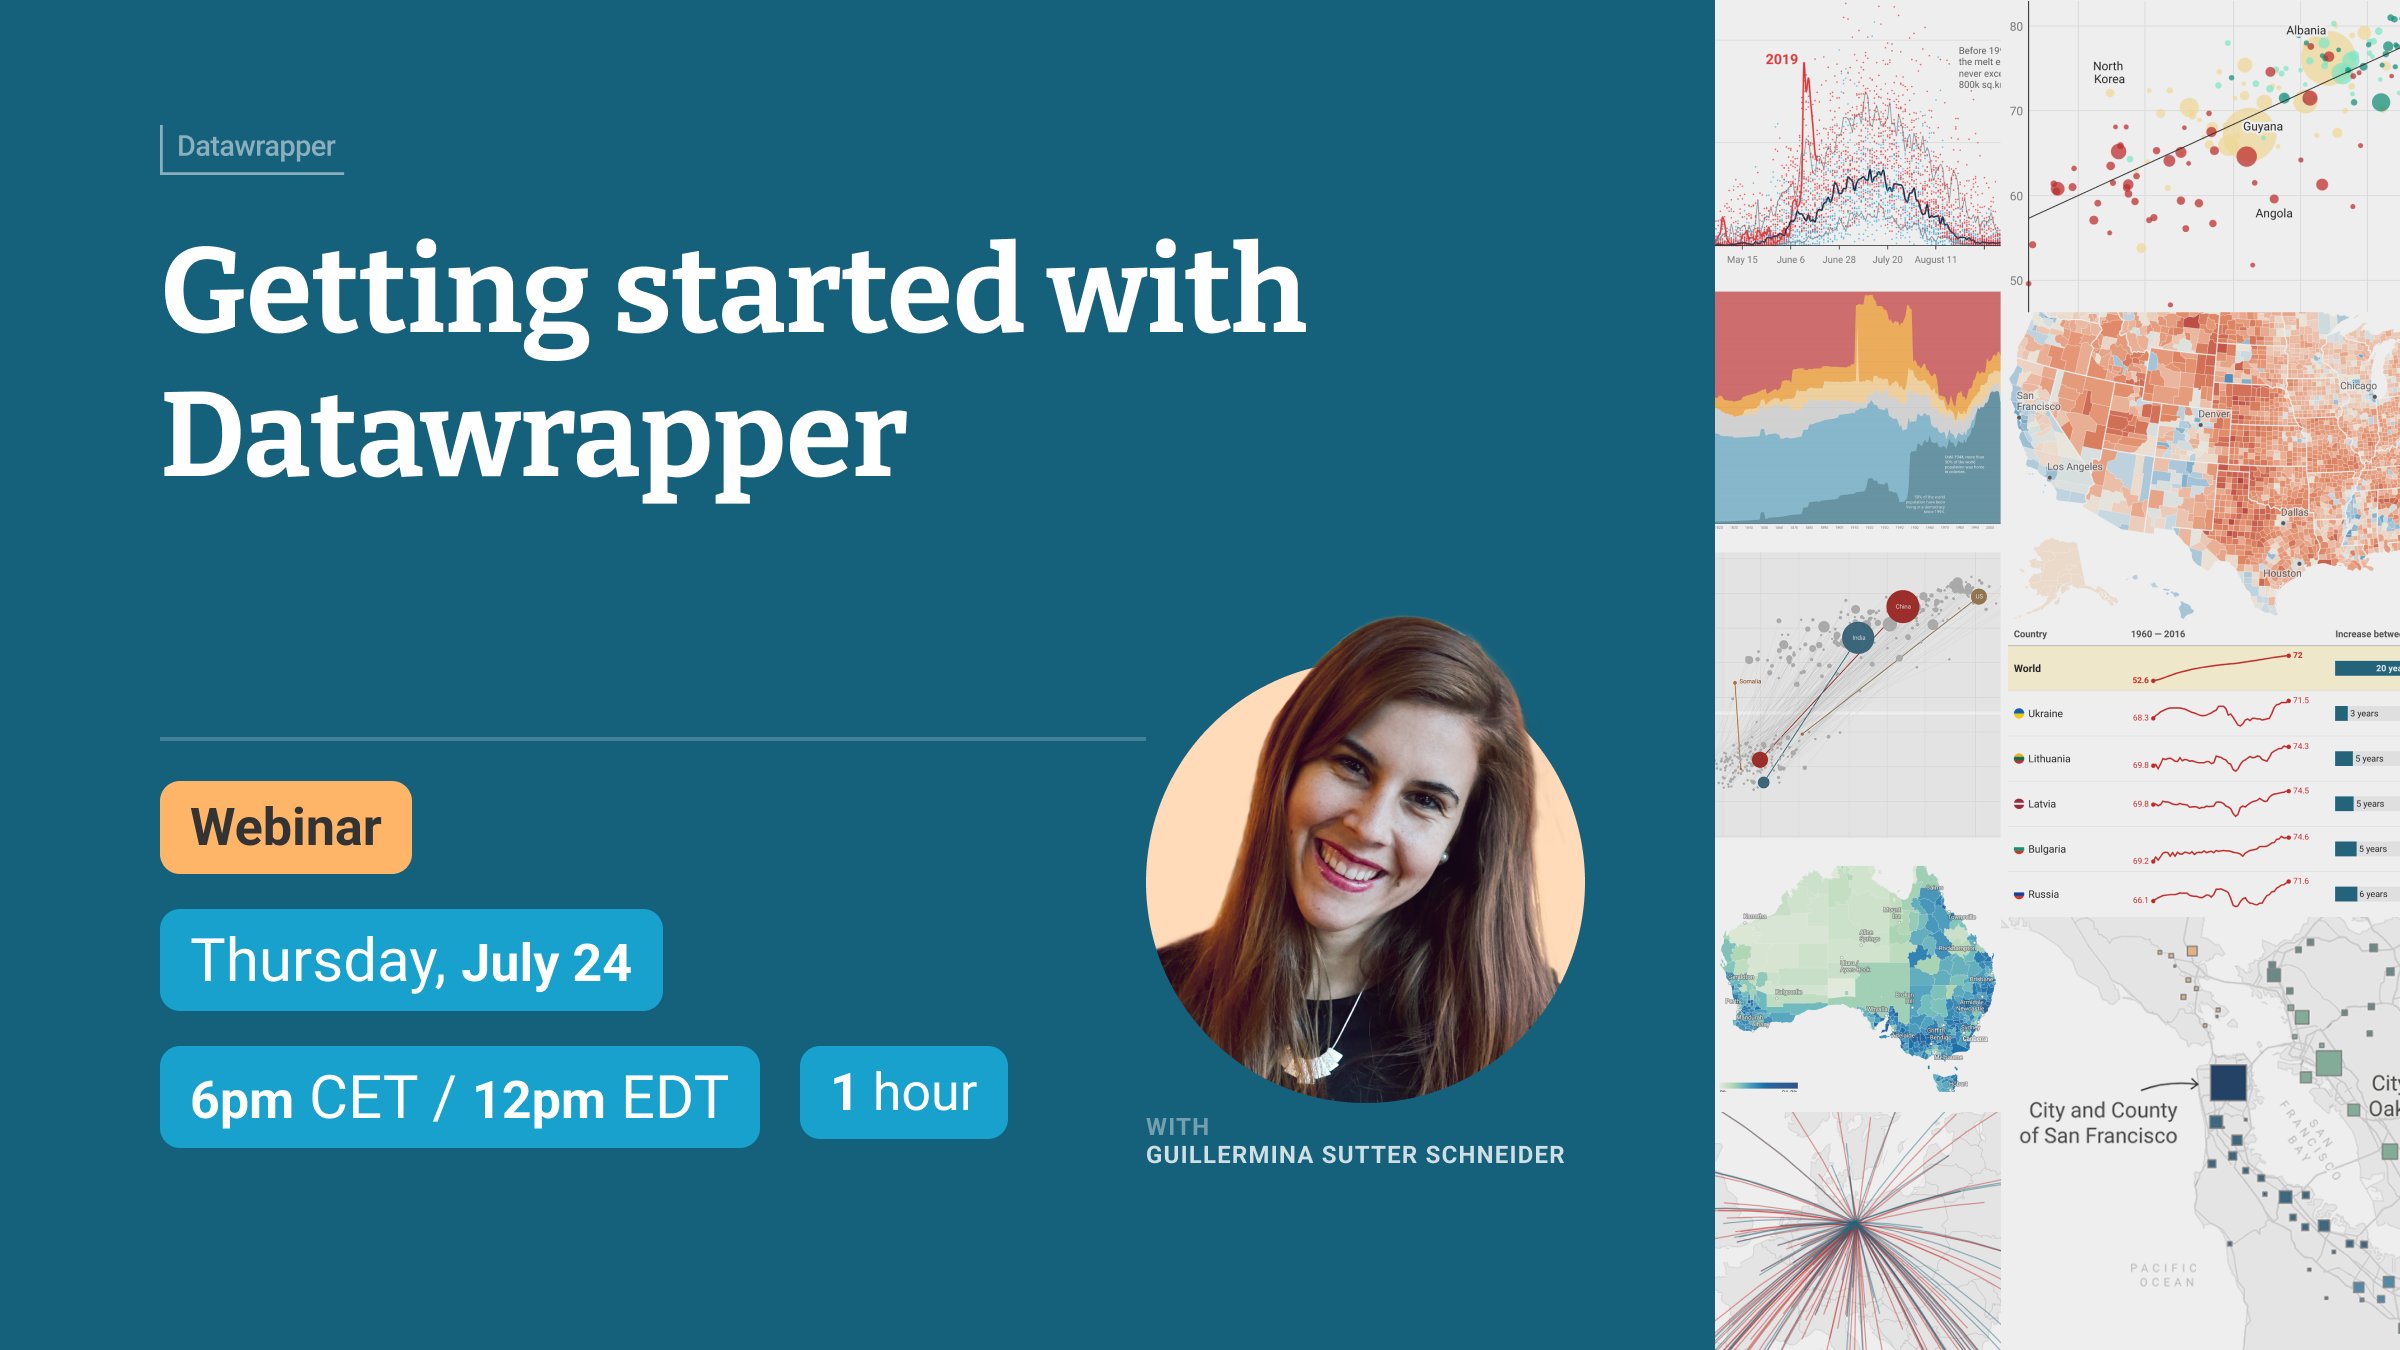
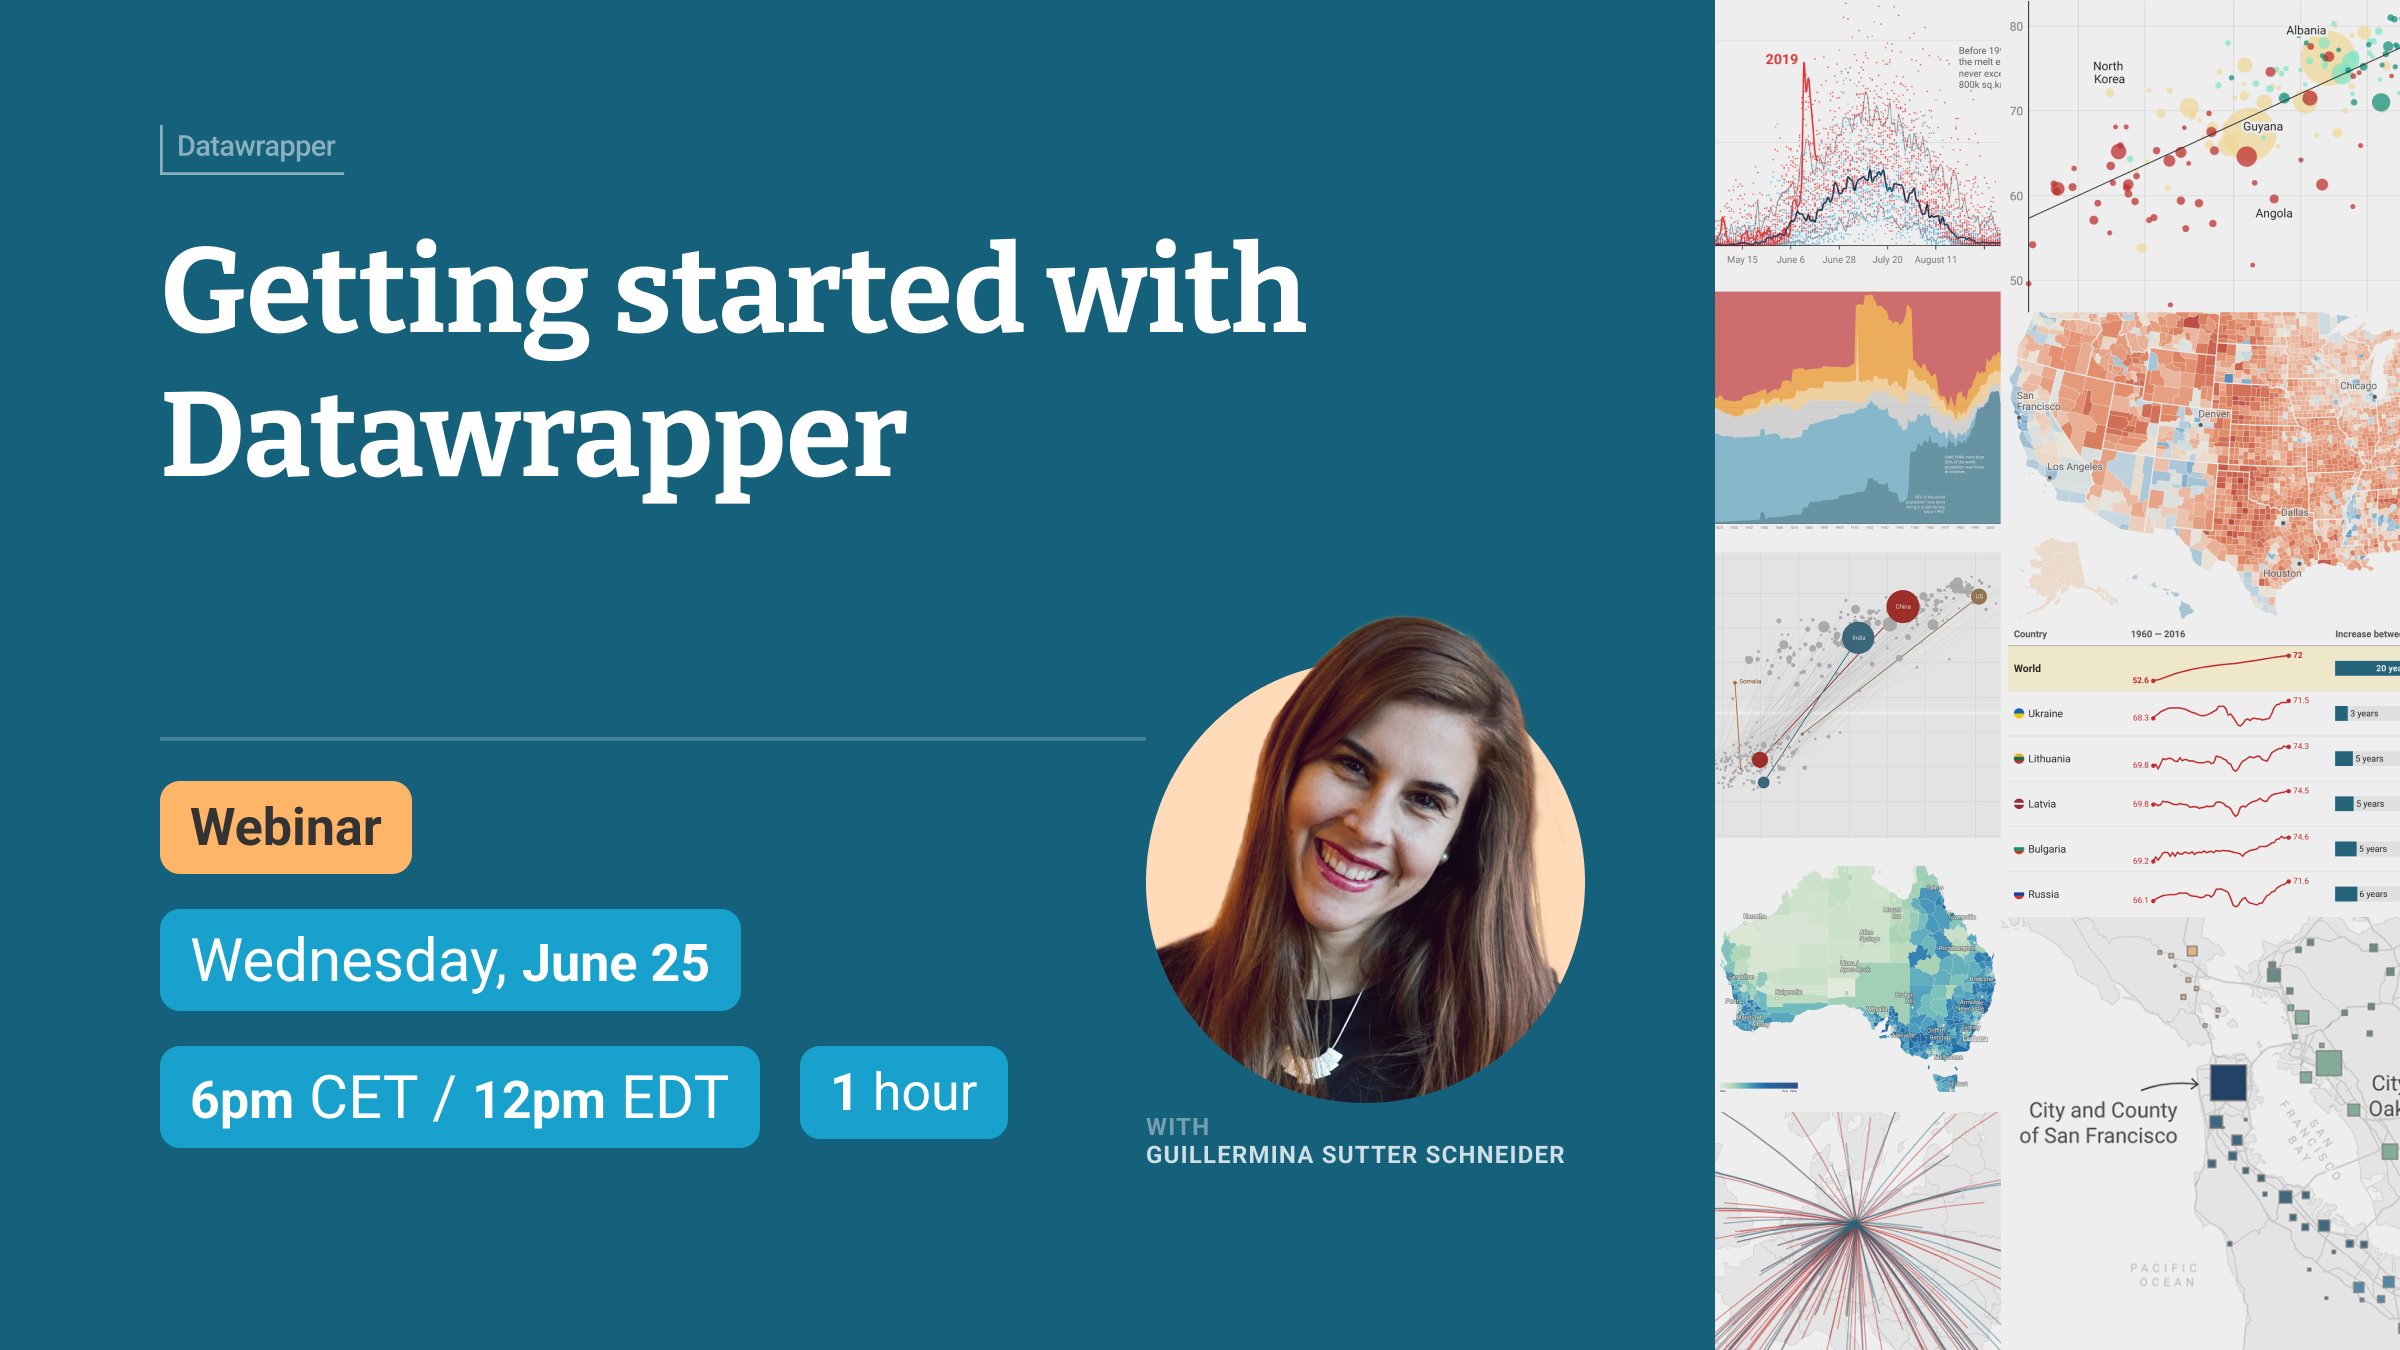
Just starting out with Datawrapper, or curious about whether it's the right tool for your project or work? There's still time to register for July's last webinar! 📆 It's happening today at 12pm EDT/6pm CET. You can register here 👇 streamyard.com/watch/AbDNpX3A…
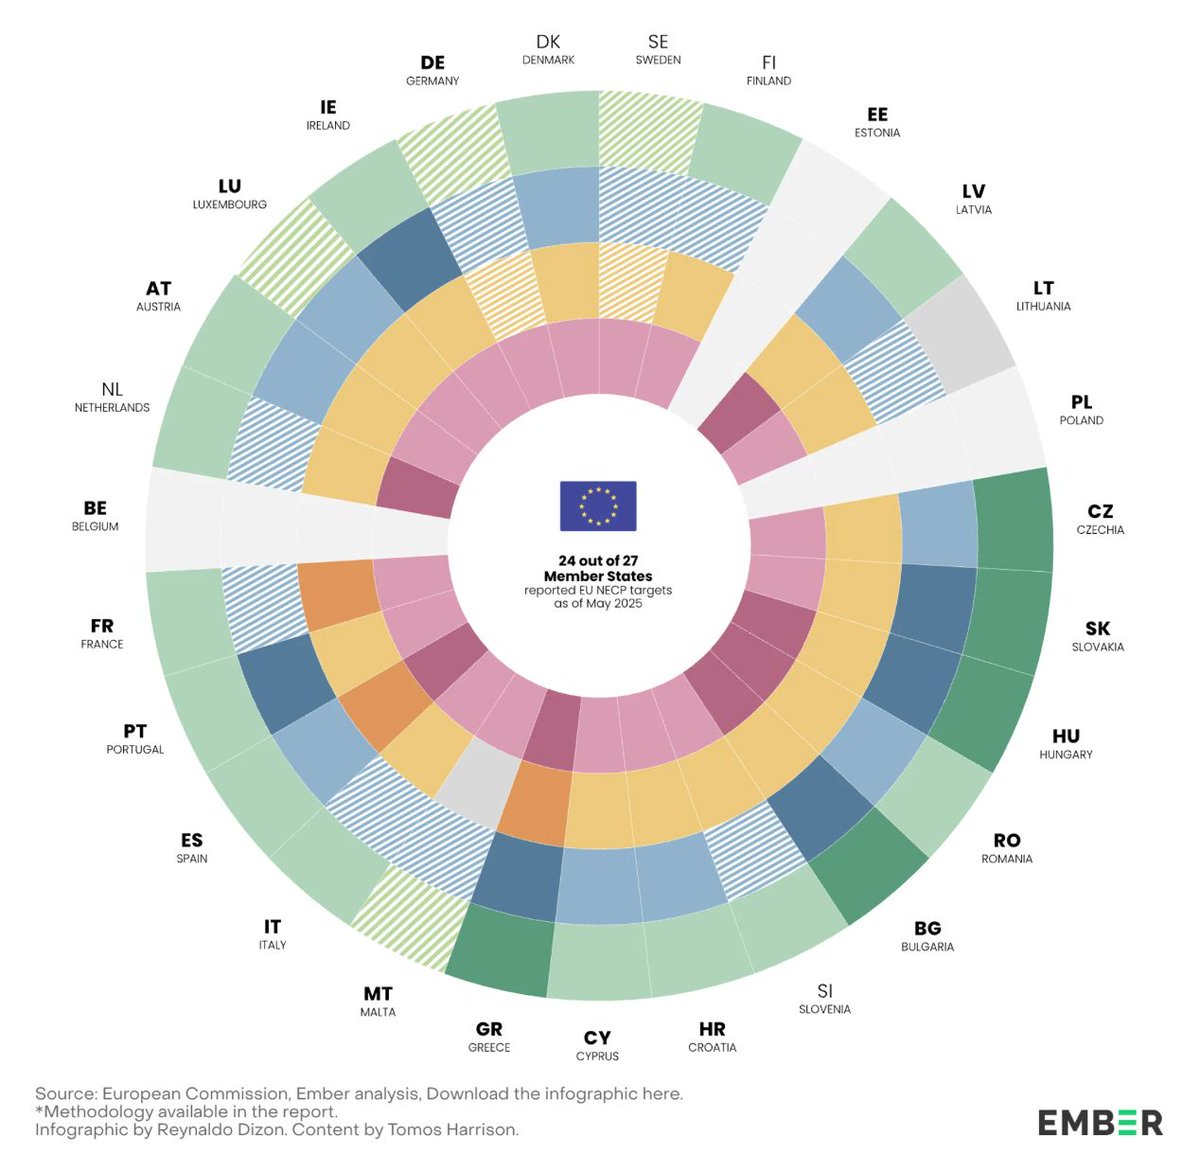
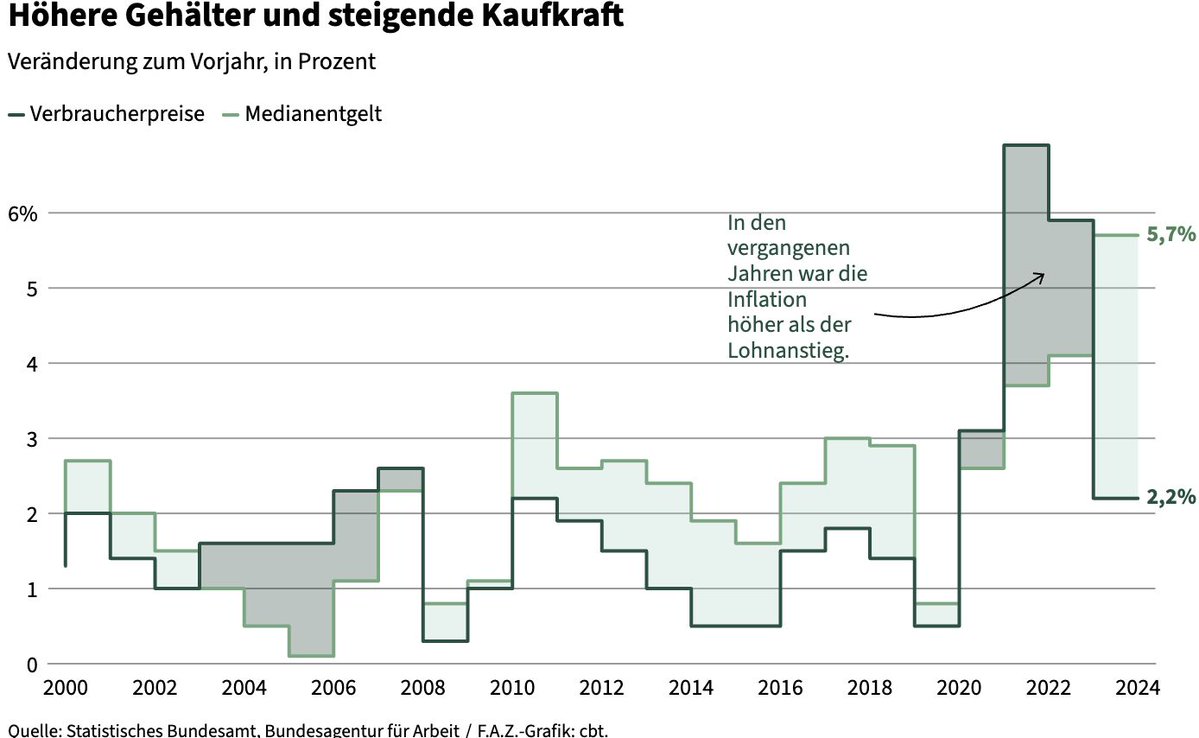
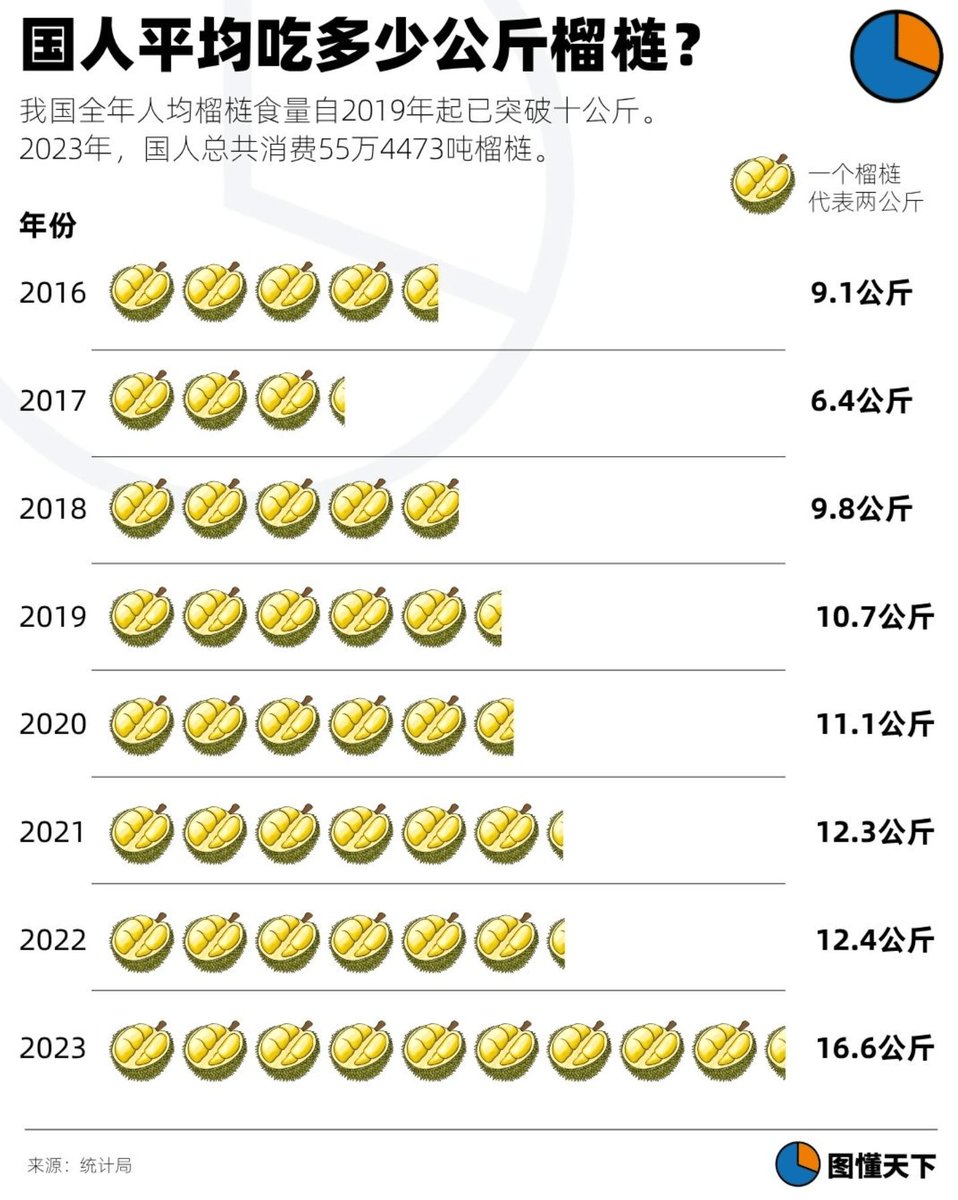
📊 This week's Data Vis Dispatch brings you a healthy mix of charts and maps, covering topics like clean energy, construction, or durians. 🏗️ ☀️ datawrapper.de/blog/data-vis-…

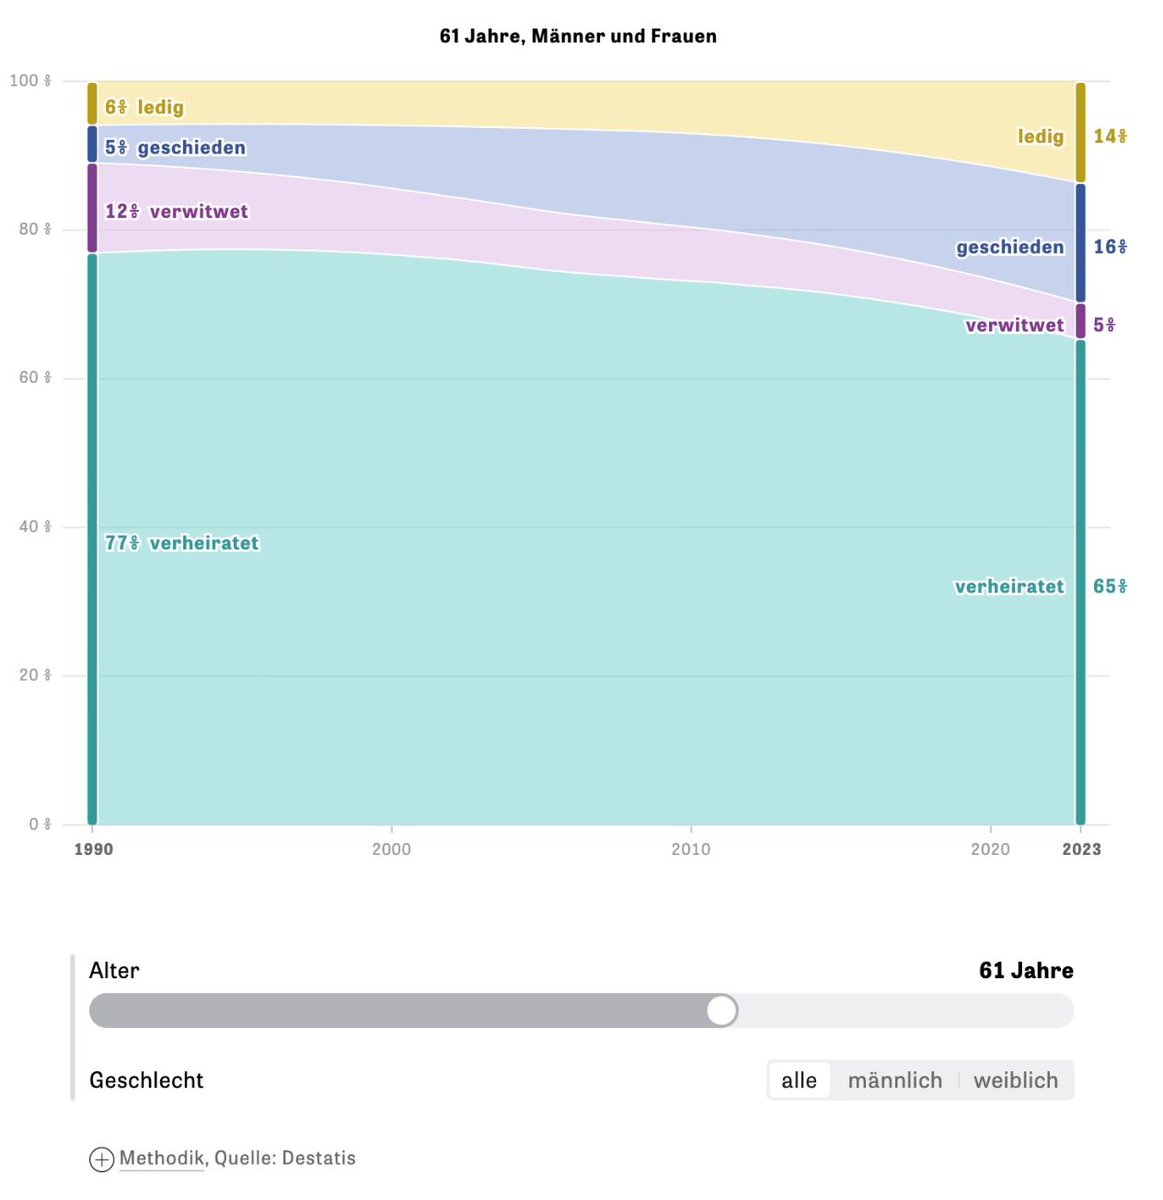
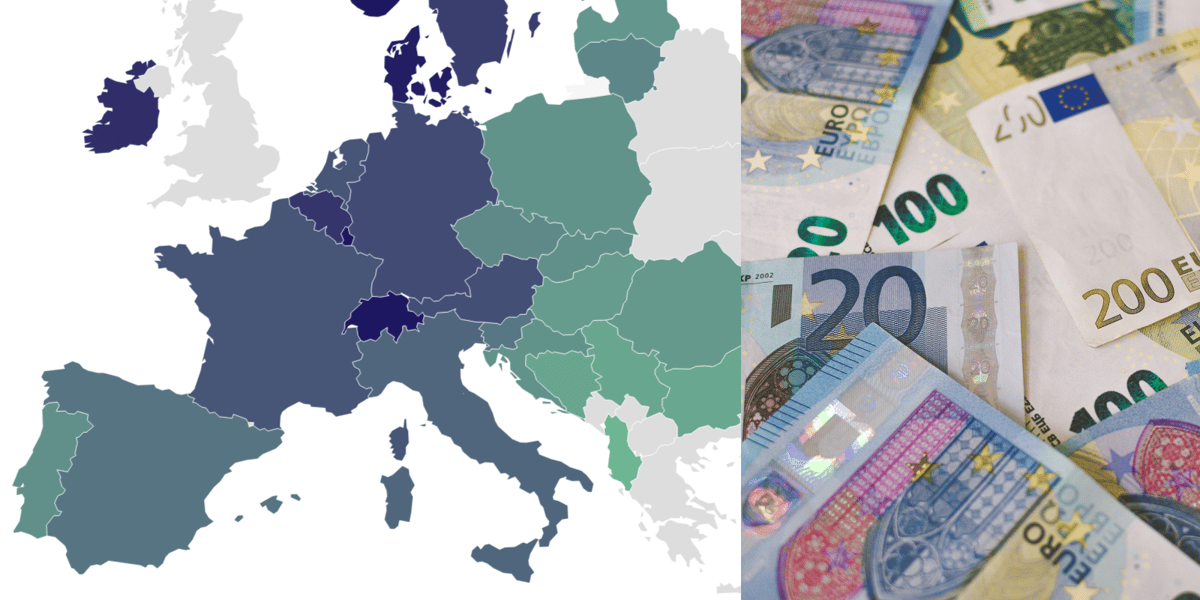
Weekly Chart ideas come to us in unexpected ways. Sometimes, as was the case for our backend developer Hendrik, a good meal at a family party leads to a thought-provoking inquiry into low wages in Europe. 🔎 💶 datawrapper.de/blog/low-wages…
We don't want to let July slip by without introducing you to Datawrapper! 🌟 Join us next Thursday at 12pm EDT/6pm CET to discover all it can do for you. You can register here 👇 streamyard.com/watch/AbDNpX3A…
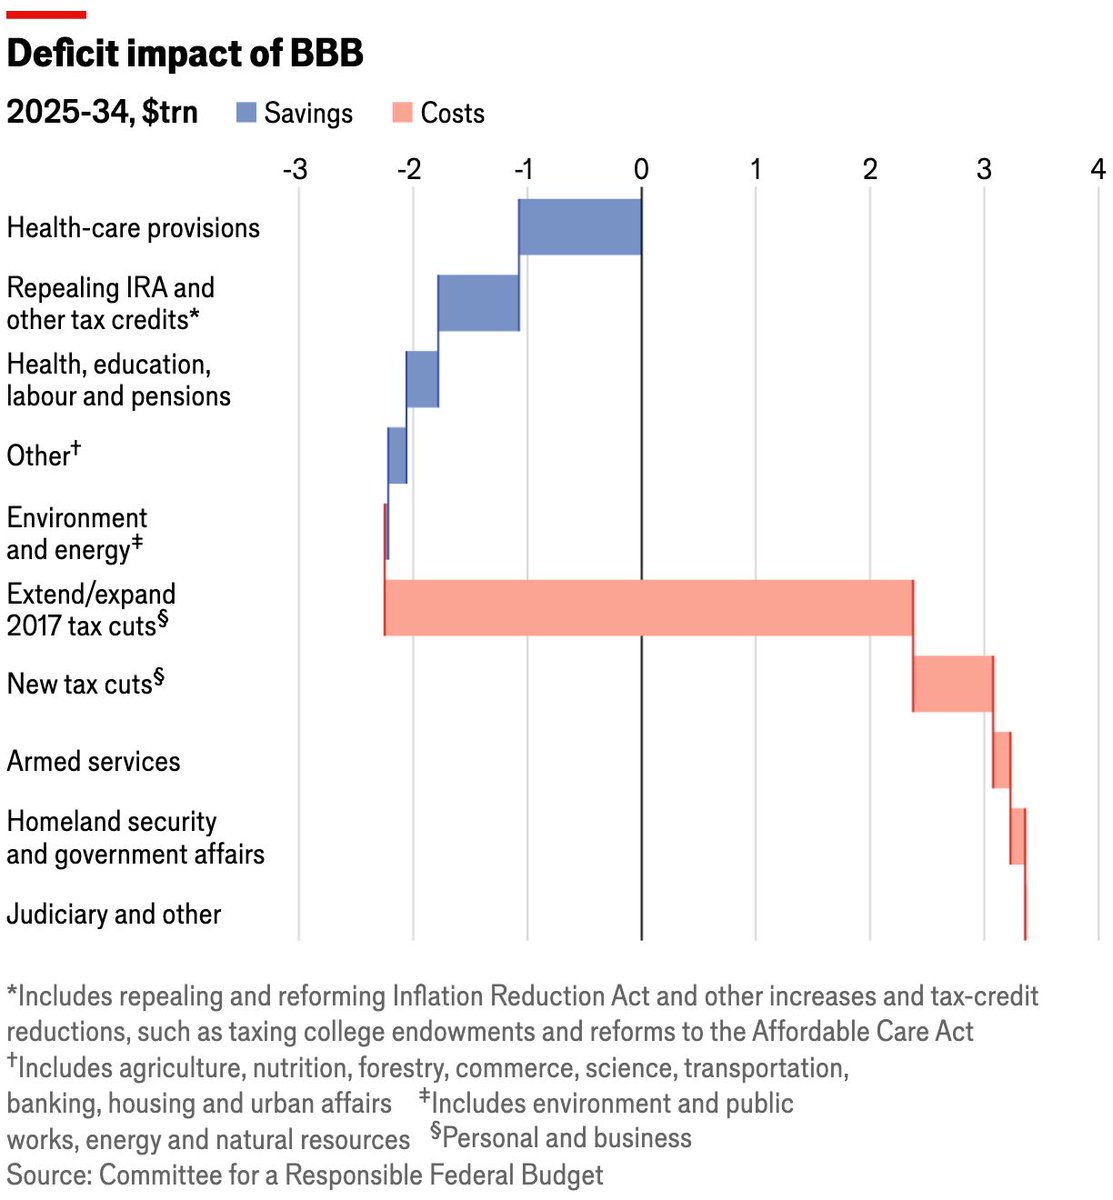
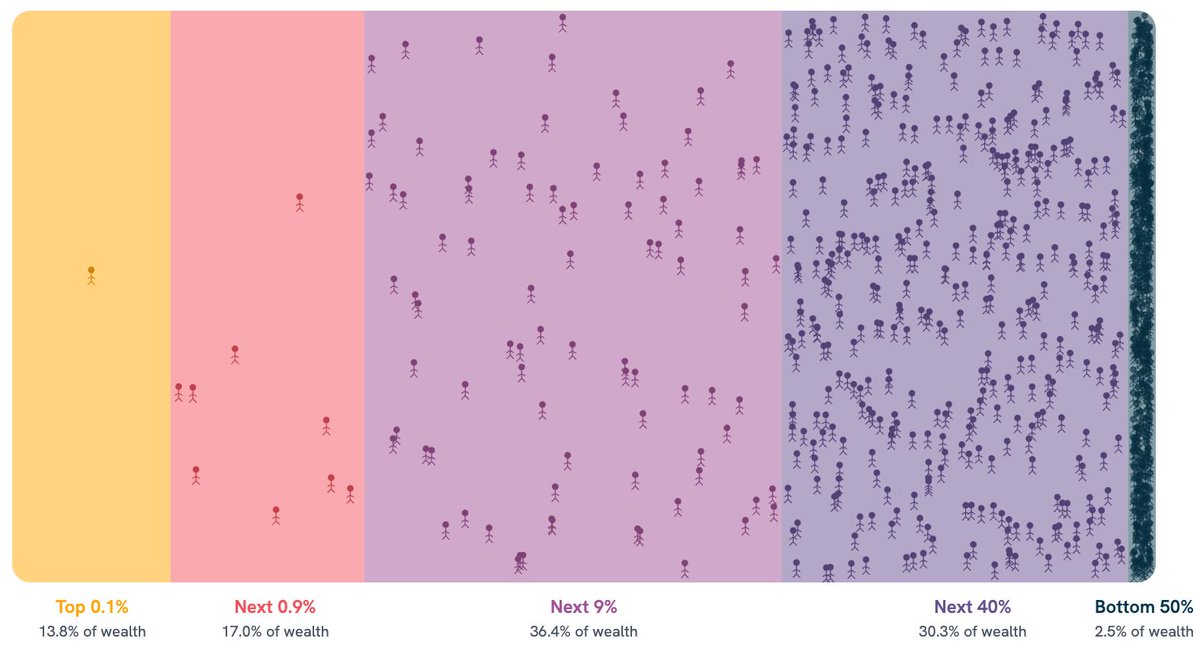
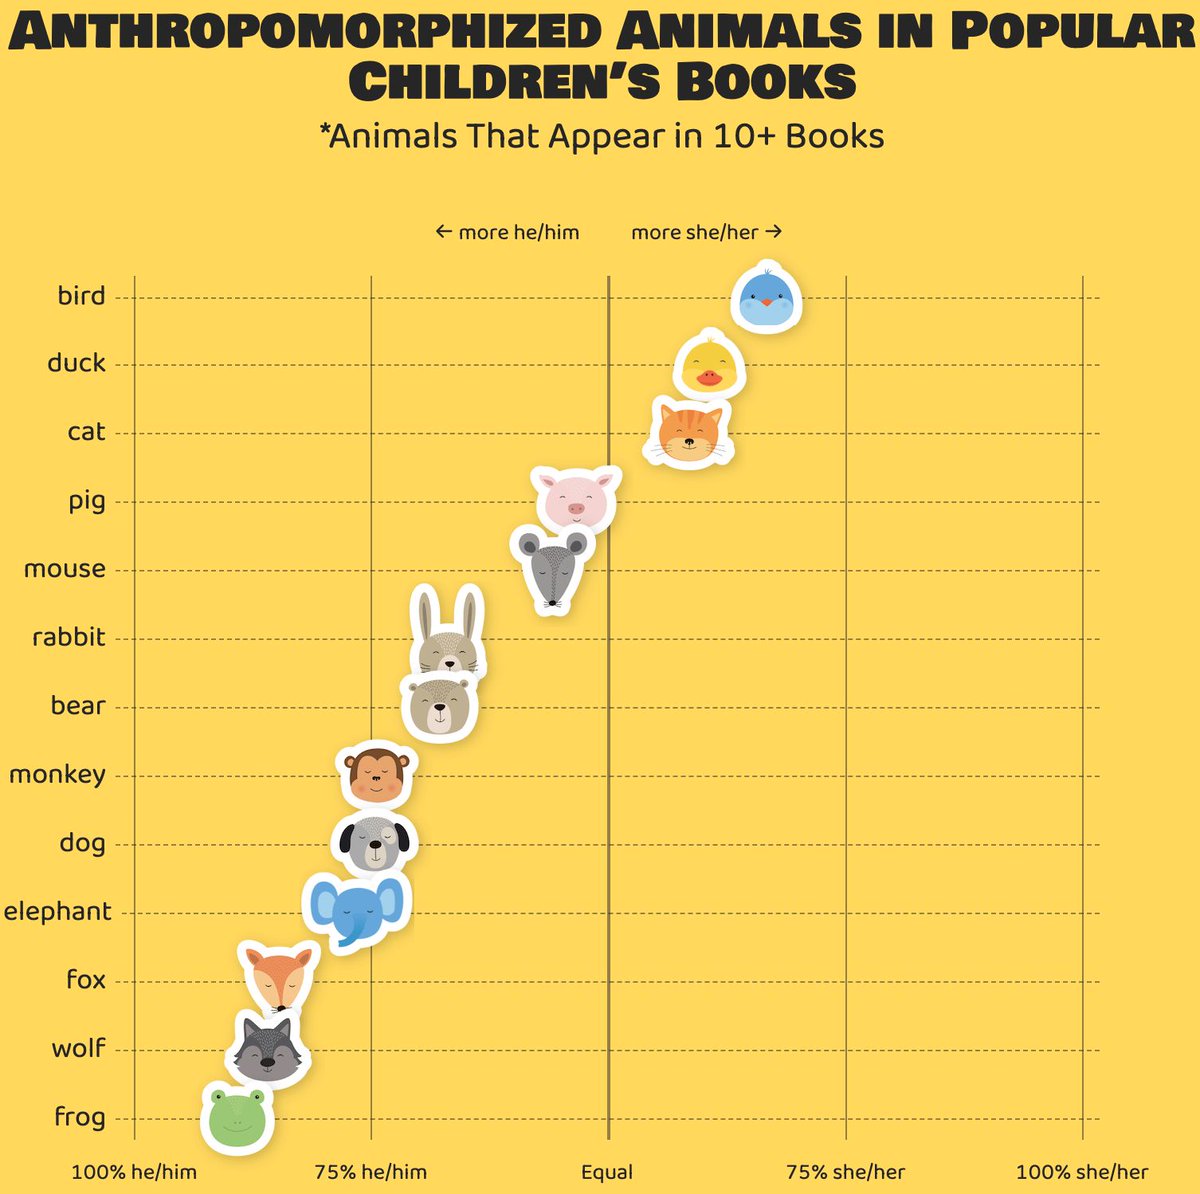
📊 The Dispatch is back with a double edition and a tiny new feature for die-hard fans! You can now use a navigation bar for a quick overview or to go to your favourites. Topics include the Big Beautiful Bill, extreme weather, and animals from children's books. 🐰…
📆 Join us on Monday, August 18th at 4 p.m. UTC to discuss @NadiehBremer's new book "CHART" on this notepad: notes.dw.tools/p/chart From familiar chart types to more abstract data art, each section showcases a wide range of visual approaches that you'll love. ✨ Curious?…
The Weekly Chart is turning 400! (Ok, in blog years.) But it hasn't stopped learning new tricks — Rose looks back at the past hundred weeks with the help of some newer features 🎂 datawrapper.de/blog/weekly-ch…
2️⃣0️⃣0️⃣ Since today marks the 200th publication of the Data Vis Dispatch, our comms team assembled this special edition, going over its history, creation process, and your feedback! 🎂 datawrapper.de/blog/data-vis-…


⏰ Today’s the day! Don’t miss our Datawrapper API with R webinar at 6pm CET / 12pm EDT. Join us to learn how to automate your workflow and create beautiful visualizations. Last chance to register! 👇 streamyard.com/watch/dyszvtni…

Do you give movies the ratings they deserve or the ones your mind secretly prefers? 🤔 Our developer Julian crunched hundreds of thousands of reviews to uncover the patterns. 🎞️ datawrapper.de/blog/movie-rev…

📚 Ready for the next book club discussion? We are! 📆 On August 18th at 4pm UTC, we’ll be diving into "CHART" by @NadiehBremer. Join us here on this notepad: notes.dw.tools/p/chart All the details for this session 👇 datawrapper.de/blog/chart-nad…
Looking to learn more about Datawrapper? Here are all the webinars happening this month: July 8 ➡️ Datawrapper's API with R for beginners July 24 ➡️ Getting started with Datawrapper Register here 👇 datawrapper.de/webinars
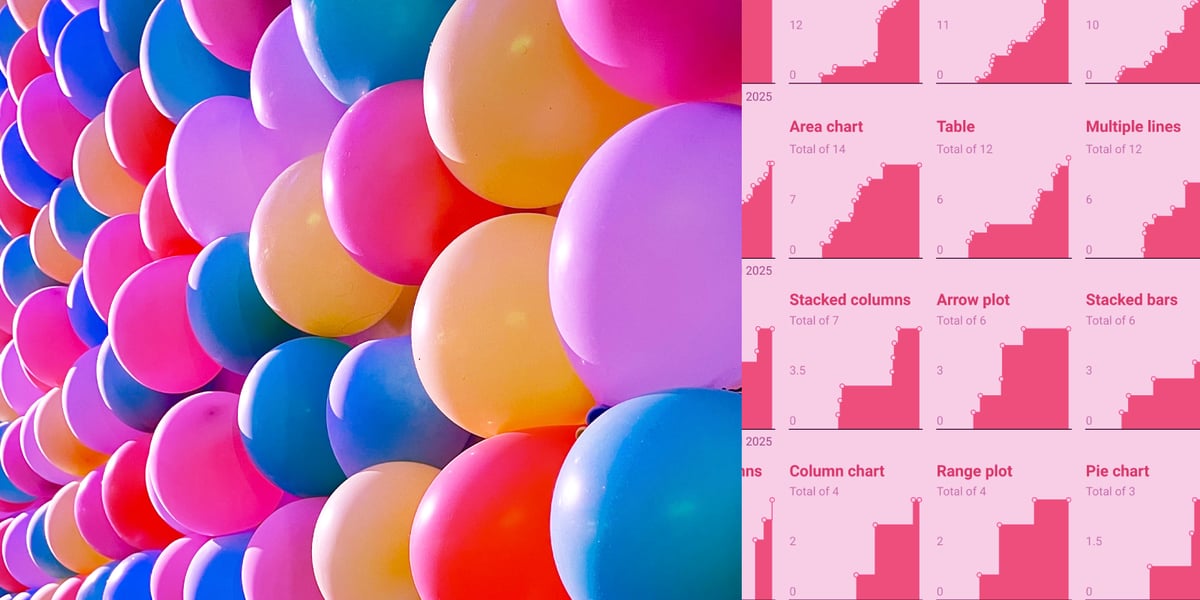
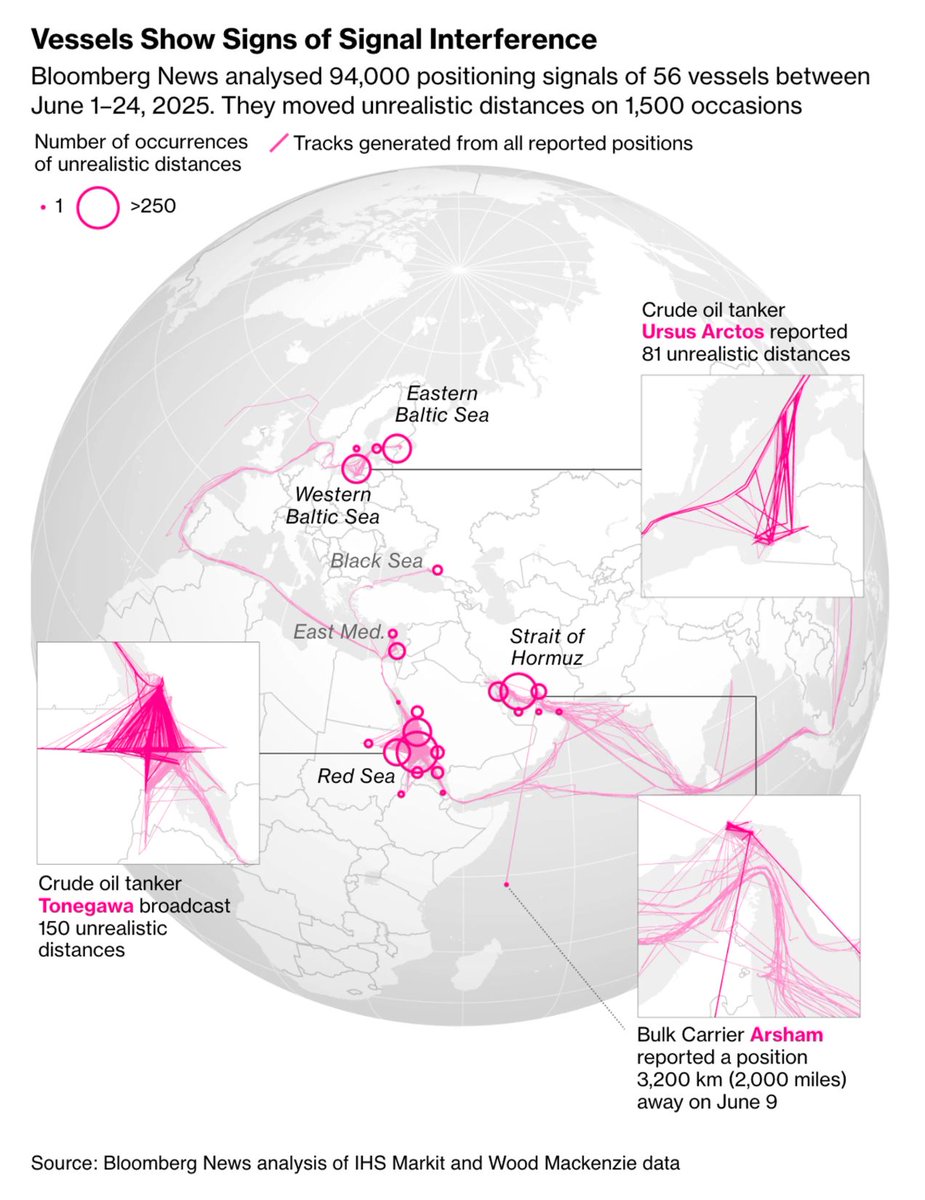
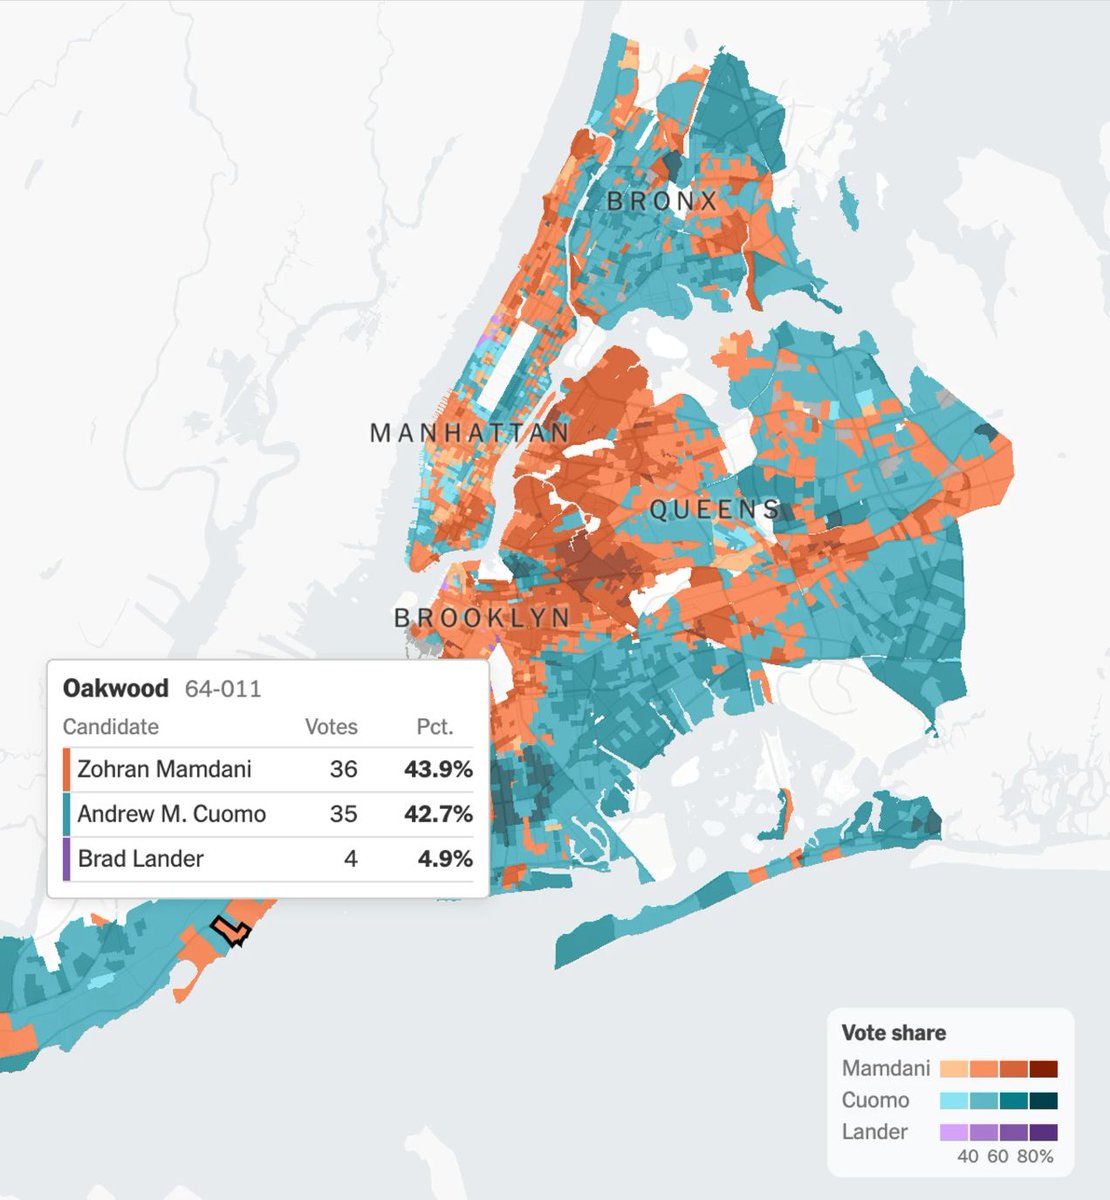
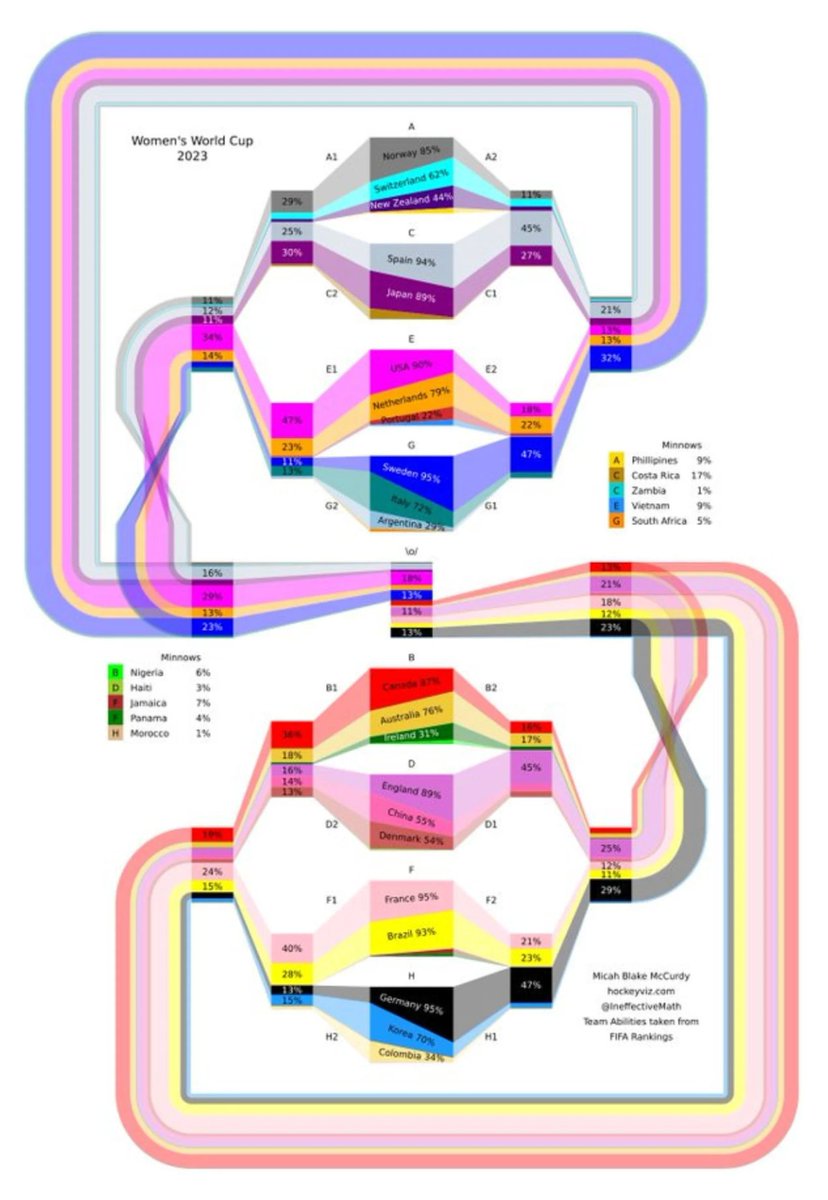
📊 Here’s a colorful preview of this week’s Data Vis Dispatch! Topics include oil tanker traffic, NYC elections, and the global race for renewable energy 🔋 datawrapper.de/blog/data-vis-…
Do you want to live a long and healthy life but walking 10,000 steps a day feels too hard? In this Weekly Chart, our designer Alex takes a closer look at the data behind this number. 🔍 Will he convince you to go for a walk? 🚶 🍃 datawrapper.de/blog/daily-ste…

🎓 Want to dive into Datawrapper? Join our intro webinar *today* at 6pm CET / 12pm EST! Learn how to create stunning visualizations and see if Datawrapper is the right tool for your projects. 📊 There's still time to register here 👇 streamyard.com/watch/ZCiaeZc6…
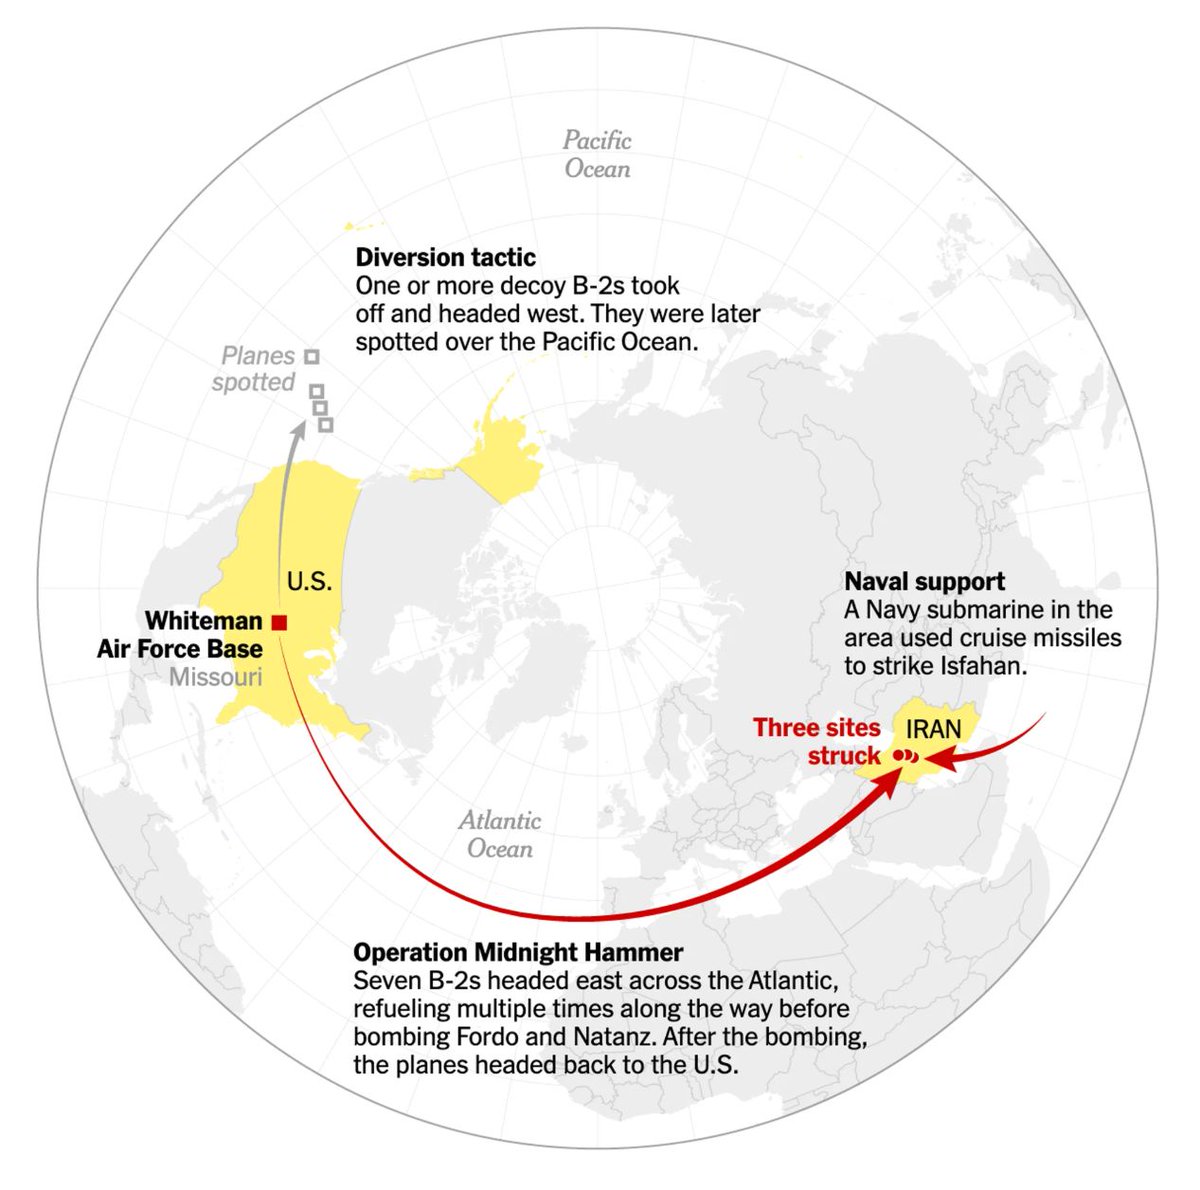
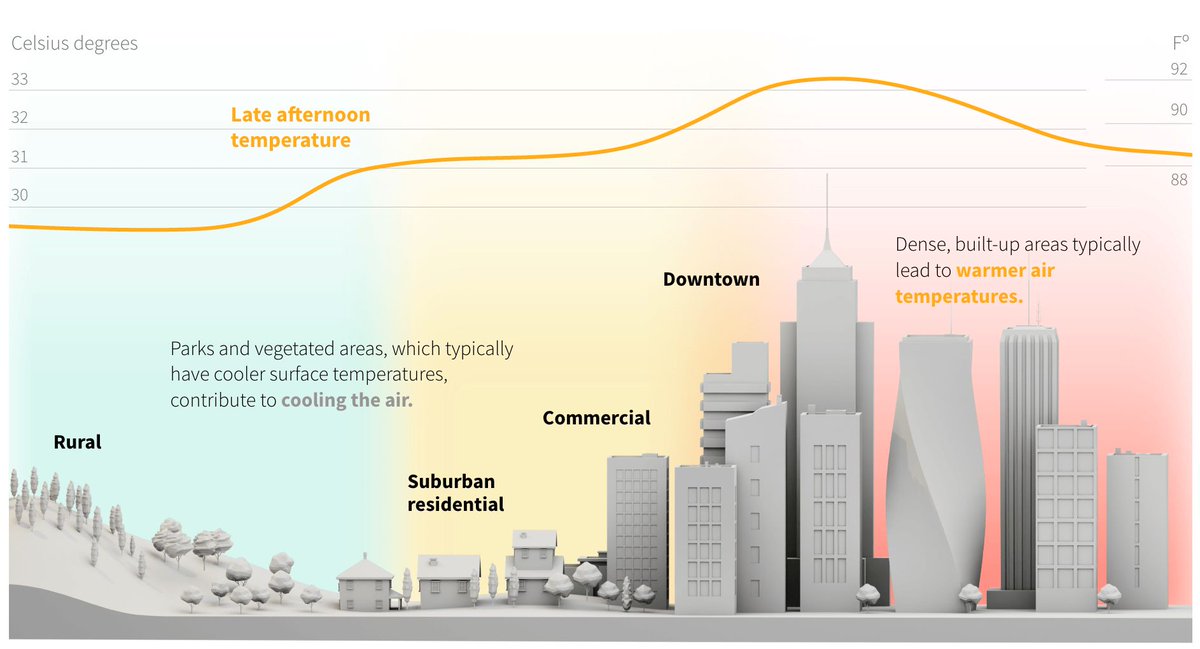
Another week of warfare in the Middle East, rising temperatures and heatwaves, and energy reports from all over the world — all this and more in the new Data Vis Dispatch! 📊 datawrapper.de/blog/data-vis-…