Daily Chartbook
@dailychartbook
The day's best charts & insights, curated: http://www.dailychartbook.com
I look at hundreds of charts a day. 📈📊📉 After the bell, I curate the best ones and send them to investors. Subscribe to be one of them 👇 dailychartbook.com

Since 1966, "there has never been a day with a smaller gain and better breadth" than yesterday. @DualityResearch
"Prime book positioning in [Semis] is at the highs (consistent with market sentiment around the group).'" Goldman Sachs via @neilksethi
"Over past week, flows into U.S. large-cap ETFs soared by nearly $10B ... investment-grade bonds saw largest outflows, followed by U.S. small caps." @DataArbor via @LizAnnSonders
"The US Money Supply grew 4.5% over the last year, the biggest YoY increase since July 2022." @charliebilello
That's the catalyst for why next decade would be double digits hyperinflation. Let my track record speaks for itself. The question now is whether we're in 1970s which is bearish or this is 1940s which is bullish. My expectation is neither those two but I'm open to be wrong.
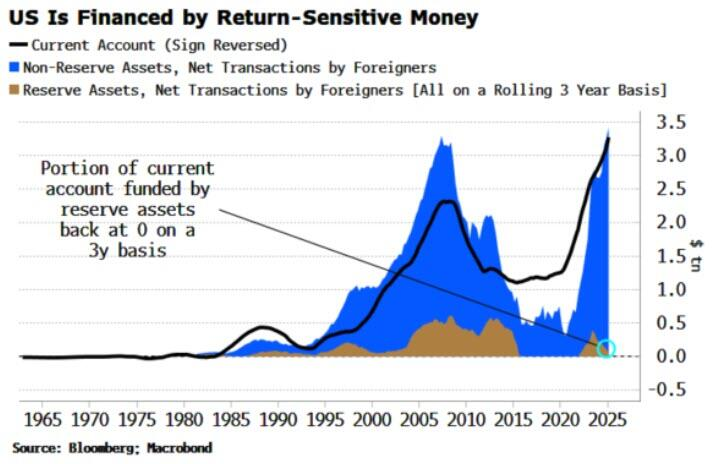
"The deficit is now almost exclusively funded by non-reserve assets, in other words those held by private buyers rather than central banks." @LondonSW via Zero Hedge
This streak of daily SPX moves not exceeding 1% is now at 19 (one short of December's streak). @dailychartbook in their excellent nightly email also had information from @AlmanacTrader that was interesting. He found there have been 175 previous 19-session streaks and separated…
BBG: The S&P 500 hasn't posted a 1% up or down day since late June (17 sessions), the longest streak since December's 20-session streak. “An old saying on Wall Street is, “Never short a dull market,’” said Dave Lutz, equity sales trader and macro strategist at Jonestrading.…
Analysts became too pessimistic and now rushing to revise EPS & price targets higher. #sentiment $SPY $QQQ $IWM
"The risk rally is supported fundamentally ... S&P 500 is in net EPS-upgrade territory and crucially its leading vs RoW for past two-months now." -SocGen Kabra
From the always great @dailychartbook nightly email (more info at the link at the bottom), Ned Davis Research has a nice "composite" seasonality chart which consists of equal weight to the normal seasonal cycle, 4-yr Presidential cycle, and 10-yr decennial cycle which has a…
BoA's Ciana also notes that the downside to the strong July is that the average Pres Year 1 peaks in July and falls around -8% by the end of the year from the peak.
📌 Gold Gold benefits from strong seasonal and technical momentum, supported by central bank demand, inflation concerns, and geopolitical risks, positioning it for a likely significant price breakout in the coming months 👉 isabelnet.com/?s=gold h/t @dailychartbook @RenMacLLC
Since 1966, "there has never been a day with a smaller gain and better breadth" than today. Source: @dailychartbook @DualityResearch
Wow
"We’ve seen retail investors pile into VIX products again ... We view this as essentially rolling demand for hedges by individual investors as a way to continually protect themselves against market pukes/vol spikes." -GS Coppersmith via Zerohedge
5 of Tuesday’s best charts and insights: dailychartbook.com/p/dc-lite-404
"Outside of a couple of ill-judged sales tax hikes, which automatically drove up inflation for a while, Japan’s inflation has barely ever exceeded US CPI in the last four decades. That’s where it is now." @johnauthers
"Analysis of earnings calls in the second quarter already showed a focus on tariffs that dwarfed by a mile the concern under Trump 1.0." @johnauthers
"Some 80% of global fixed income assets now offer yields above 4% as interest rates have settled above pre-pandemic levels." @BlackRock
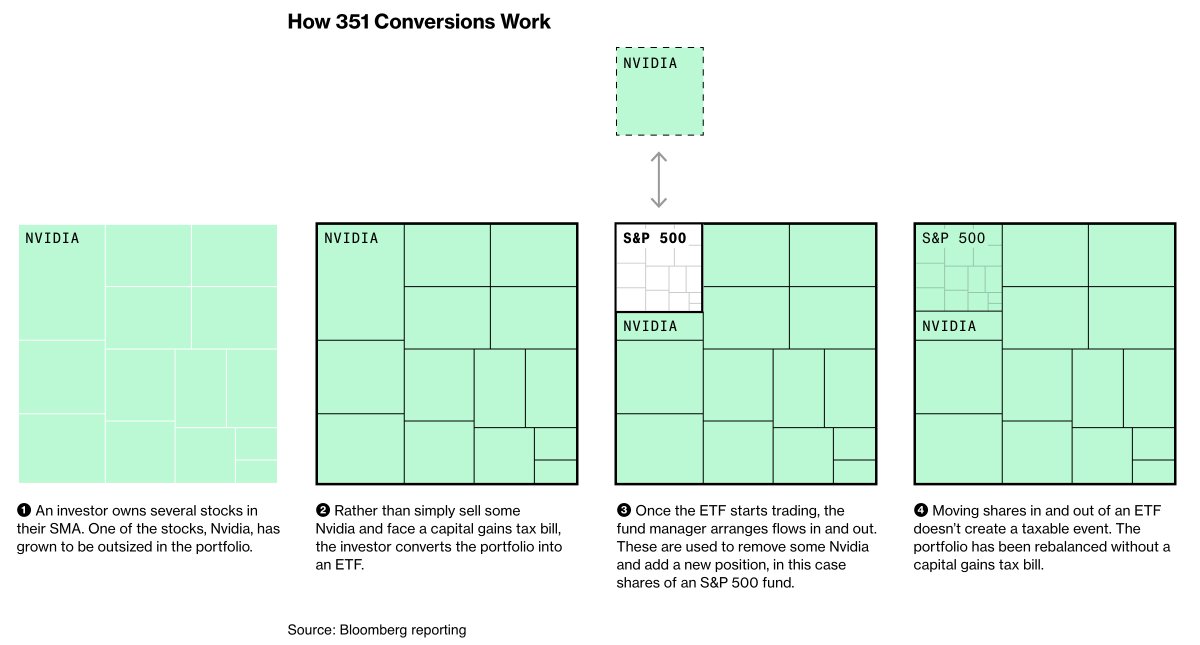
"Wealthy investors are using a clever ETF trick to sidestep US capital gains taxes—and it’s completely legal." @justinaknope
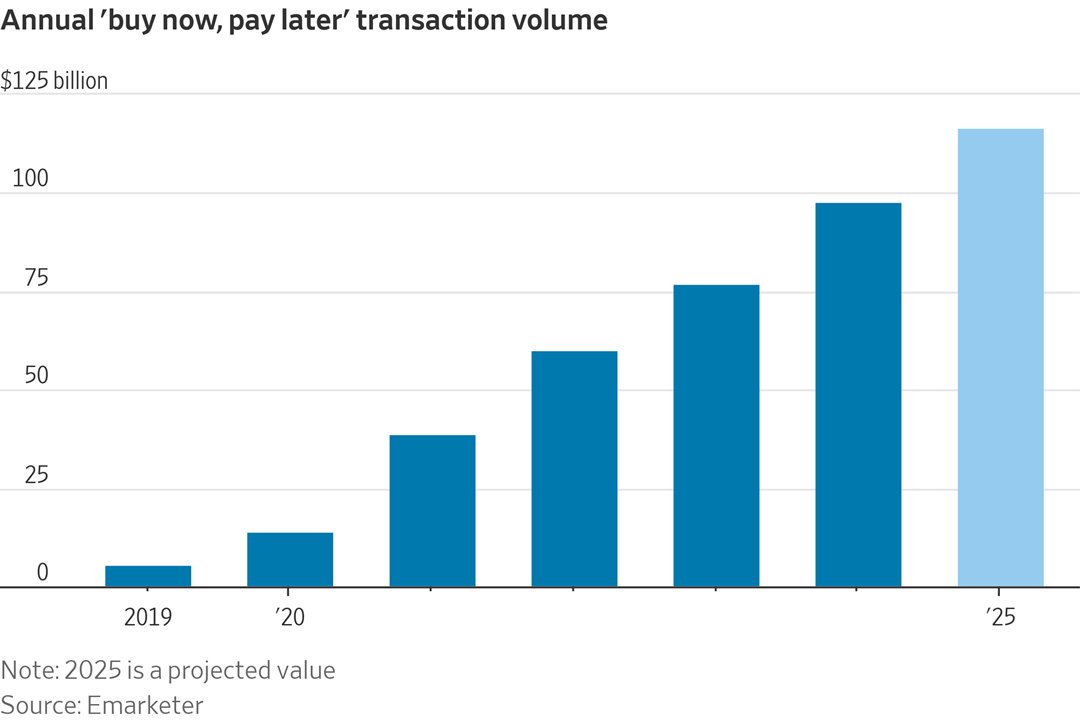
"BNPL transaction volume is expected to reach $116.67 billion in 2025, according to Emarketer, up from $13.88 billion in 2020." @MoiseNoise
"The deficit is now almost exclusively funded by non-reserve assets, in other words those held by private buyers rather than central banks." @LondonSW via Zero Hedge
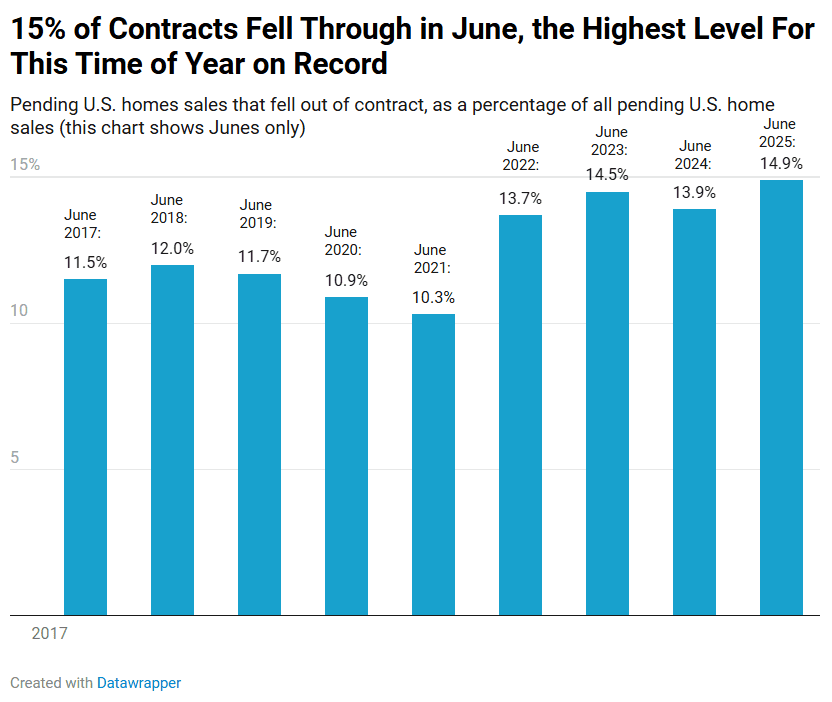
"14.9% of pending home sales fell through in June ... the highest June share in records dating back to 2017." @Redfin
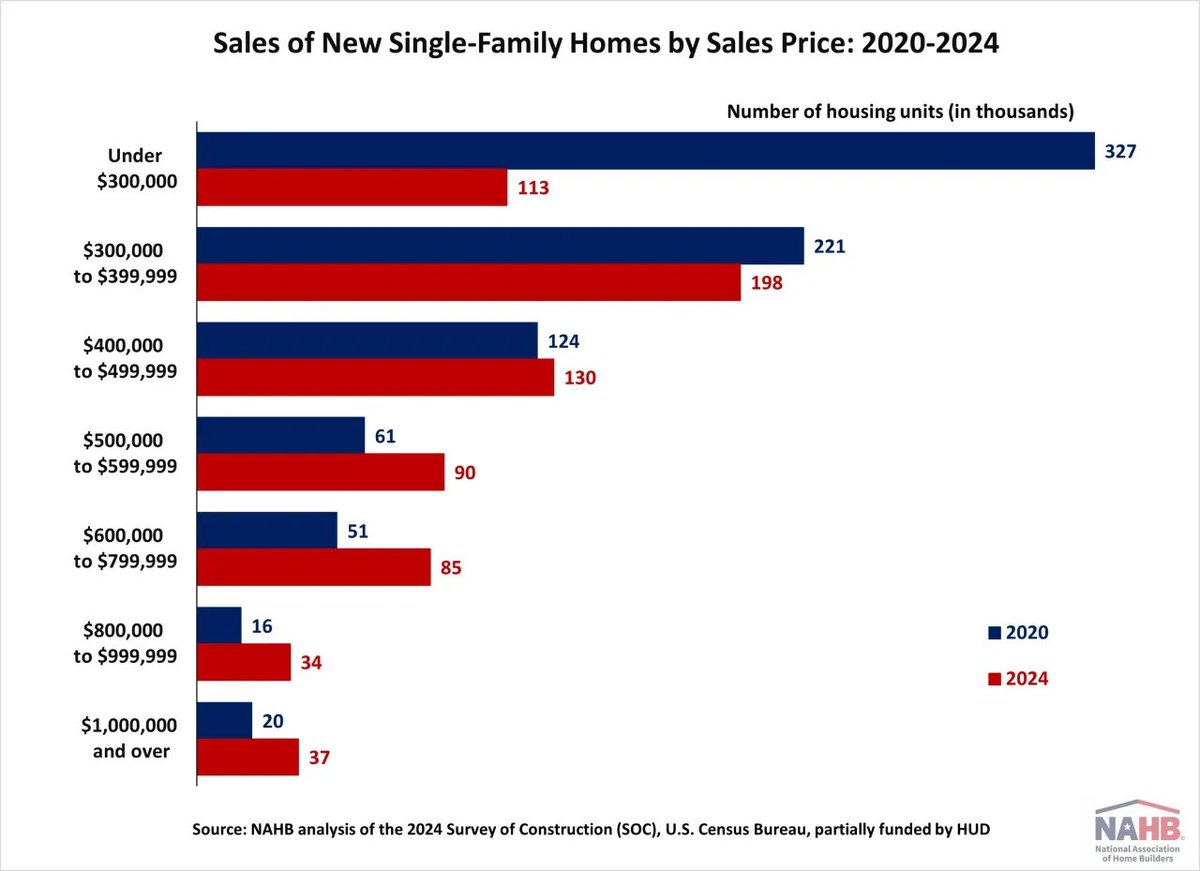
"From 2020 to 2024, sales of lower-priced new homes declined significantly as the market moved toward higher-priced segments." @NAHBhome