NOAA NCEI
@NOAANCEI
National Centers for Environmental Information (NCEI), an office of @NOAA, is the Nation’s leading authority for environmental data.
💧 We’ve got drought stats from June 2025 to keep you informed. Learn more: bit.ly/USDM0625 #DroughtMonitor @Droughtgov

Happy launch-iversary, GOES-U! 🚀🛰️ One year ago today, we watched as #GOESU, the final satellite in @NOAA’s GOES-R Series, soared into space from @NASAKennedy. How time (and satellites) fly! Renamed #GOES19 once in orbit, it's keeping watch over the Western Hemisphere from…
🌡️ Extreme heat is sweeping the U.S.! Our team at the National Weather Service shares a few essential tips to stay safe. Keep cool, hydrated, and check on your neighbors. Visit weather.gov/safety for more details!
.@NOAA’s Center for Satellite Applications and Research (STAR) at NESDIS helps keep the nation prepared for #hurricane season with vital satellite data and tools that support critical decisions–even after the storm has passed. Learn more about STAR’s contributions by reading the…
We’re 1 month into the North American Monsoon season, which runs from June 15 - Sept 30. So far, most monsoon precip fell on NM & W. TX, though parts of AZ & CO are getting significant rain this week. Short-term outlooks lean dry in much of the SW. drought.gov @NOAA
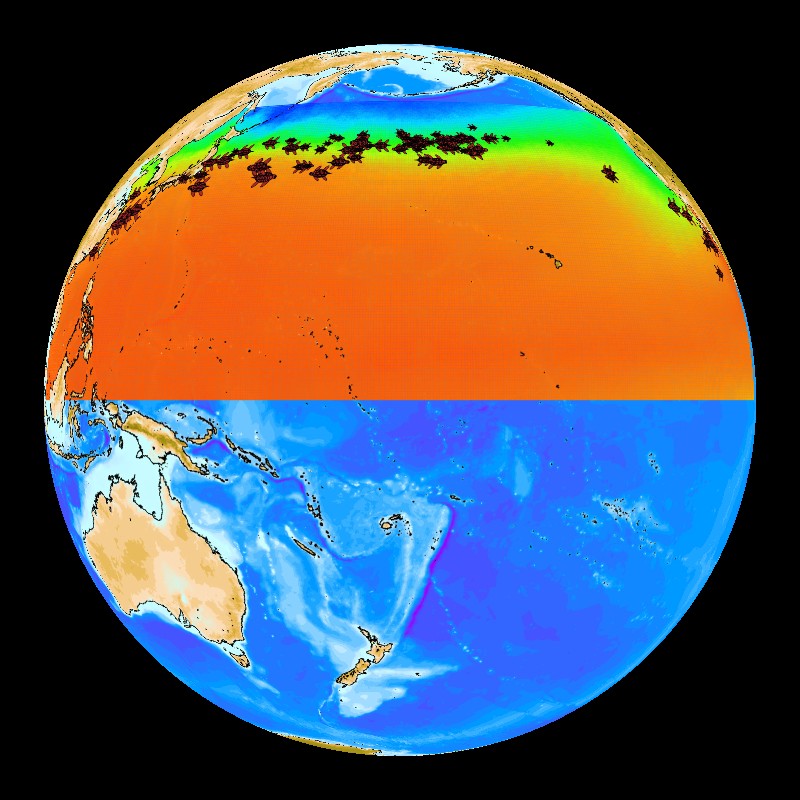
Just in: #June 2025 was Earth’s 3rd-warmest June on record Find our report with maps/images at: ncei.noaa.gov/access/monitor… via @NOAANCEI
Just in: Heat wave at month's end made #June 2025 7th-warmest June on record for U.S. See this month's report with maps and images at: ncei.noaa.gov/news/national-… via @NOAANCEI
Every summer, scientists measure hypoxic levels in the Gulf of America. Rapid overgrowth of algae in coastal waters results in a smaller supply of oxygen, forcing marine life to leave or die. Read more about the economic impacts of hypoxia here: bit.ly/HypoxiaWatch

Looking for information on temperature and precipitation impacts near you? Quarterly Temperature and Precipitation Impacts and Outlooks are now available from @NOAA and partners: bit.ly/RTPIO062025

How is drought affecting your neighborhood❓ Enter your city or zip code at drought.gov/drought/ #DroughtMonitor

Do you know your Blue IQ? Watch our new series to learn how to have the best beach day ever - from planning before you go, how to avoid threats in the water, and what to do in a worst-case scenario! oceantoday.noaa.gov/blueiq/welcome…
☀️ If you’re feeling the thrall of summer in the Northern Hemisphere, celebrate the start of the summer solstice and astronomical summer with NCEI today. So what's the difference between the two types of seasons (astronomical vs. meteorological)? bit.ly/NCEIseasons

🐢 Happy #WorldSeaTurtleDay! Did you know NCEI scientists created the Beaching Probability Index (BPI) to help researchers understand why sea turtles become injured/sick? Learn more at: bit.ly/TurtleBPI

☀️ Did you know that the warmest day of the year can occur in September or October in certain parts of the United States? Check out our map to determine the warmest day in your area, and read more at: bit.ly/WhenToExpectWa…


Just in: #May 2025 was 2nd-warmest on record for the globe Both poles saw below-average sea ice coverage. --> Find more stats + download map images from our report at: ncei.noaa.gov/access/monitor… via @NOAANCEI
Just in: U.S. just saw it's 2nd-warmest #spring on record. Find summary and stats + map images from our report at: ncei.noaa.gov/news/national-… @NOAANCEI
NCEI celebrates #WorldEnvironmentDay every day with a bounty of environmental data. Check out our treasure trove of information: ncei.noaa.gov

A G3 (Strong) geomagnetic storm was observed at 29/0216 UTC in response to negative polarity coronal hole high speed stream influences. A G3 warning is valid until 29/0600 UTC. Stay tuned for updates.
How is drought affecting your neighborhood❓ Enter your city or zip code at drought.gov/drought/ #DroughtMonitor

💧 We’ve got drought stats from May 2025 to keep you informed. Learn more: bit.ly/USDM0525 #DroughtMonitor @NOAADrought
