
Visual Studio Debugger
@VS_Debugger
We are the Microsoft Visual Studio Debugger team. You can reach us through: Tweets, comments on our blogs, VS Developer Community and at [email protected]
🚀 Don’t miss our Build 2025 session! See how GitHub Copilot in Visual Studio is transforming debugging—from stepping through code and fixing exceptions to tackling deadlocks and boosting performance and much more. build.microsoft.com/en-US/sessions…
🔍 Debugging LINQ in VS2022 is now a breeze! Hover over individual LINQ clauses while debugging to inspect runtime values via DataTips or the Visualizer. Need clarity on what a clause does? Click the Copilot icon in the DataTip for an instant, AI-powered breakdown.

🚀 Want to get serious about performance? Now you can capture profiling traces from benchmarks and optimize them with Copilot! Visual Studio Profiler + BenchmarkDotNet = instant trace when you run benchmarks. Learn More: benchmarkdotnet.org/articles/featu… youtube.com/watch?v=X1J1wD…
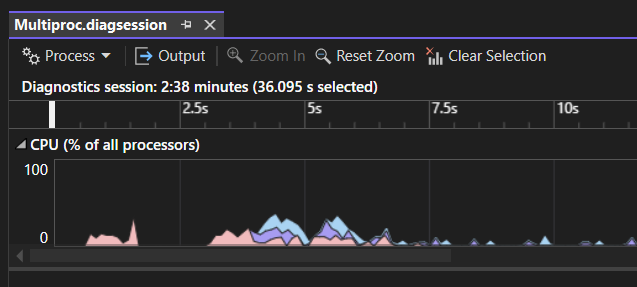
🚀 Dive into multi-process CPU usage analysis with Visual Studio! 🖥️ Discover how to diagnose and optimize CPU performance across multiple processes with ease. Check out the new features and streamline your workflow! 🔍 devblogs.microsoft.com/visualstudio/m…
🚀 Exciting news for C++ developers! You can now enjoy full debugging capabilities on optimized builds. Breakpoints and step-ins dynamically deoptimize code, giving you the best of both worlds: top performance and seamless debugging. 💻✨ Dive in today! devblogs.microsoft.com/cppblog/cpp-dy…

🚀 Enhanced Editable Expression in IEnumerable Visualizer! Generate and refine LINQ queries with inline chat and Copilot Chat dialog, now with IntelliSense, color syntax, and editor-like consistency. Try it out and share feedback! tinyurl.com/2ash4fsb
Lost in a maze of threads and stack traces? Visual Studio’s AI-powered thread and app summaries with enhanced Parallel Stacks Window will help you uncover thread actions, detect deadlocks, and fix issues in no time. devblogs.microsoft.com/visualstudio/m…

Today we celebrate 28 years of Visual Studio! From its original box art to the powerful IDE we know today, it’s been an incredible journey. Celebrate with us by sharing your first project below 👇#Microsoft50
Introducing the Scalable Debugger Popup—a highly requested feature that dynamically adjusts popups such as DataTips' size based on editor’s zoom level! This improvement ensures a seamless and consistent experience between the Editor and Debugger. Try it out and give us feedback!

🚀Debugging multi-threaded code just got easier! With AI-powered thread summaries and app summarization in Parallel Stacks, Visual Studio helps you quickly troubleshoot thread activities. Test it out and give us your feedback! Read more: tinyurl.com/2uhycv25 #VS2022 17.13 GA
💥 Ready for a workflow upgrade? GitHub Copilot is now built into Visual Studio at each any every step. 🖥️ AI-powered coding 🐞 Smarter debugging and profiling 🧪 Simplified testing and much more... Try it today for FREE in latest Visual Studio. youtu.be/VVnOU3iCuOU?si…
While you are in a break state during debugging, you can hover over individual clauses or segments of your LINQ query and evaluate the immediate query value at runtime. Coming soon to Visual Studio...
🚀 AI-powered IEnumerable Visualizer! Now with inline chat, use GitHub Copilot to craft and refine LINQ queries to filter your data. Need more control? Continue refining in the Copilot Chat window! ✨ Read more: tinyurl.com/2uhycv25 #VS2022 17.13 GA
🚀 The Visual Studio Profiler now supports multiprocess CPU analysis! 🔹 Color-coded stacked area charts for each process 🔹 Swim lanes for clear visualization 🔹 Process filtering via dropdown for focused insights Analyze performance like a pro!

If you don't have time to follow Visual Studio on YouTube, read the blog, or otherwise get your news, then the new VS Hub page might be a great resource for you. It's a one-stop-shot that makes it easy for you to catch up on everything Visual Studio from a variety of sources.…
Visual Studio Users, We Need Your Feedback! We're working on improving the Performance Profiler, and we want to hear from YOU! What would make the Profiler launch page more helpful or easier to use?

GitHub Copilot Exception Analysis and Variable Analysis now intelligently leverage your project context to identify and highlight relevant code contributing to errors. Coming soon to Visual Studio...
Chat is essential. Code generation is powerful. Iteration is key. Copilot Edits in VS2022 gives you a whole new way to work with AI. Iterate on code across multiple files, review in-line with all your context & stay flexible with checkpoints. devblogs.microsoft.com/visualstudio/i…
🎉 GitHub Copilot for Visual Studio is now FREE! 🎉 Get 2,000 completions and 50 chat messages per month, plus access to Claude 3.5 Sonnet and GPT-4o. Check out our latest blog post for more info: msft.it/6011UMrGf
Curious about improving your code performance? Explore how the "Visual Studio Profiler" makes benchmarking easy and insightful. Learn how to optimize performance, reduce bottlenecks, and make your apps faster and more efficient devblogs.microsoft.com/visualstudio/b…
