
NQ Stats
@NQStats
NQ Stats provides free actionable statistical insights and market analytics tailored for the NASDAQ-100 E-mini ( $NQ ). Created by @ProbableChris
NQ Stats was created to catalog various metrics centered around $NQ. It is a collection of many years of testing for various analytical edges. To give back to the trading community, these concepts and ideas are shared for free. NQ Stats was created by @ProbableChris
Will save this here for easy access. A thread of community made indicators covering various NQ Stats related content.
Starting to see people create and sell Trading View indicators based on the content, stats and concepts I have shared for free. If you are someone who has created indicators and/or tools and are sharing them for free, please post them in this thread so others can avoid…
Realtime check of the historical "IB Breaks" stat. Since 1-May-2025 there have been 53 total trading days. Out of those 53 sessions, 42 of them broke to the side that the stat/concept leaned towards for that given day, creating a 79.2% forward tested hit rate, essentially…
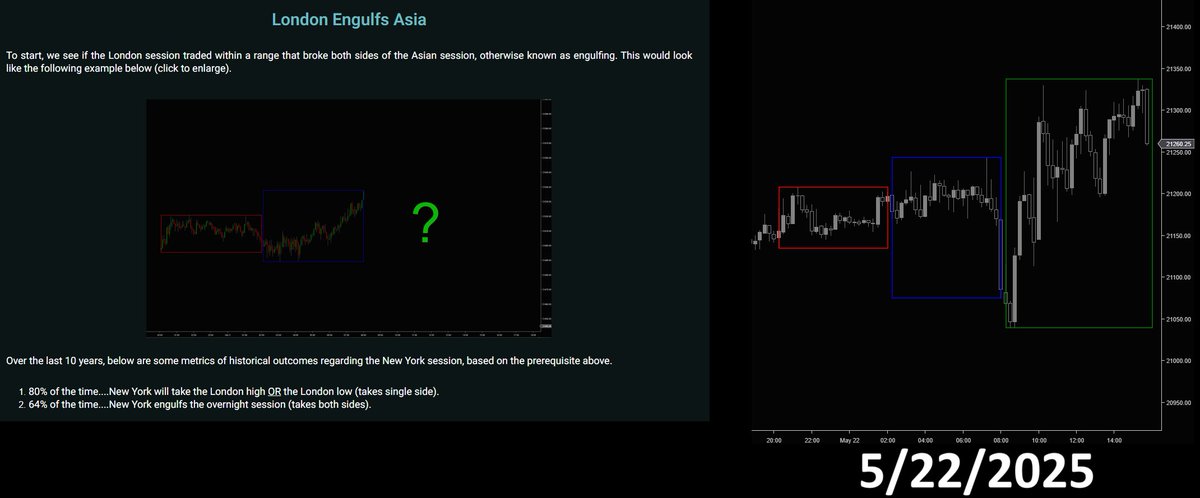
Reviewing this morning, when the London session (2am - 8am ET) engulfs the Asia session (8pm - 2am ET), this creates 1 of 4 possible patterns. Shown is pattern #1. Over a 10yr sample, from 2015-2025, Pattern #1 resulted in either the London high or London low being ran 80% of…
"ALN Sessions" looks at how various patterns form during the Asian and London market sessions. Based on these patterns, what has historically happened during the New York session? nqstats.com/aln-sessions
Starting to see people create and sell Trading View indicators based on the content, stats and concepts I have shared for free. If you are someone who has created indicators and/or tools and are sharing them for free, please post them in this thread so others can avoid…
Yesterdays (6/25) detailed "Noon Curve" review. See quoted post for the trade that was taken and posted using this data. Learn more at nqstats.com/noon-curve
$NQ | 6/25/2025 Trade #2 +3R This short is based on "Noon Curve" data. Check the link below to learn more, but expectation of a new low post 12pm was the bias. Waited for a pullback into the AM range and entry criteria to be met, risking the swing high of the entry leg. Went…
For those familiar with the "Noon Curve" and "IB Breaks" stats/data, here is a confluence based stat putting the two together.... Over a 10yr sample between 6/19/2015 to 6/19/2025, roughly 2,500 trading days, when the IB broke before 12pm ET (noon), the direction of the break…
For today, knowing that IB breaks 83% of the time before 12pm, this morning IB closed in the upper half. Historically when IB closes in the upper half, the IB high is broken 81% of the time. Learn more at nqstats.com/ib-breaks
i appreciate the words, brother -- the stats are ALL from Chris so super credit to him. I hope people realize how valuable his information is -- and the fact that it's free is simply insane. Ive been an institutional trader at a big bank. macro trader at chicago based prop…
youtu.be/2ZaUzugtCw4 Quick video going over a specific discussion point from a 1-on-1 Q&A I did today with someone.
youtu.be/mY_Qu2bBf5o Quick video on three tips you can use for trading the "Hour Stats".
calendly.com/nqstats/30min Opening the calendar for this week. Feel free to reserve one of the available 30-min slots. These will be 3:00pm-3:30pm EST. As a reminder this is for if you want to discuss or get clarification on anything NQ Stats related such as a specific stat,…

Asia and London session will only form four possible scenarios/patterns. Todays session gave the "London Engulfs Asia". This creates statistical profit targets. Visit nqstats.com/aln-sessions to learn more.
youtube.com/watch?v=-awfVU… This video discusses various data/statistical elements used to form bias/confluence and just overall interpret price as it paints on the chart. If you have any questions, feel free to post.