
Len Lardaro
@ladardo
Professor of Economics, University of Rhode Island
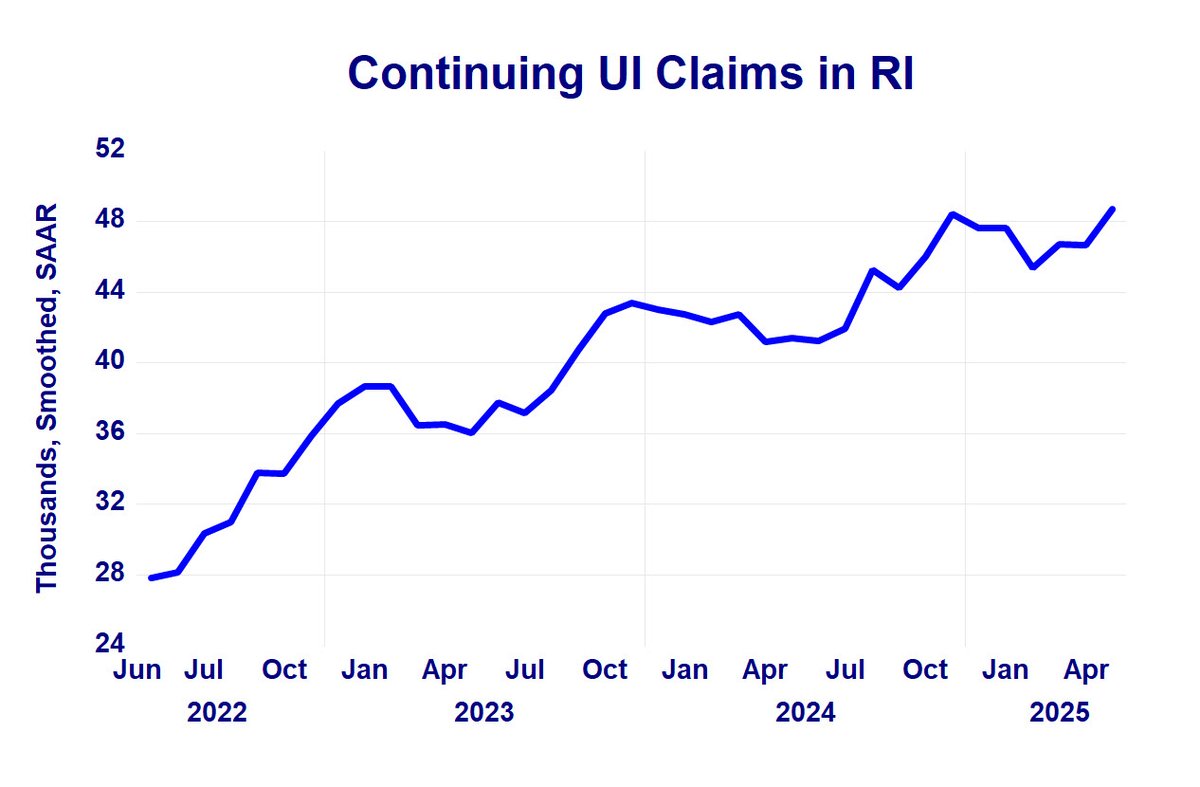
Another disturbing labor market trend in Rhode Island: Continuing UI claims continue to rise. It's getting increasingly difficult to find jobs here, as the similar uptrend in benefit exhaustions further illustrates.
4/ FYI: The participation-adjusted unemployment rate for RI rose to 6.4 percent in June, as both the labor force participation rate and the employment rate fell (again!).
3/ Interestingly, RI payroll employment was revised slightly lower for May, so weakness in that employment measure might not just be a one-month phenomenon. But the cardinal rule: Never place too much weight on data for a single period.
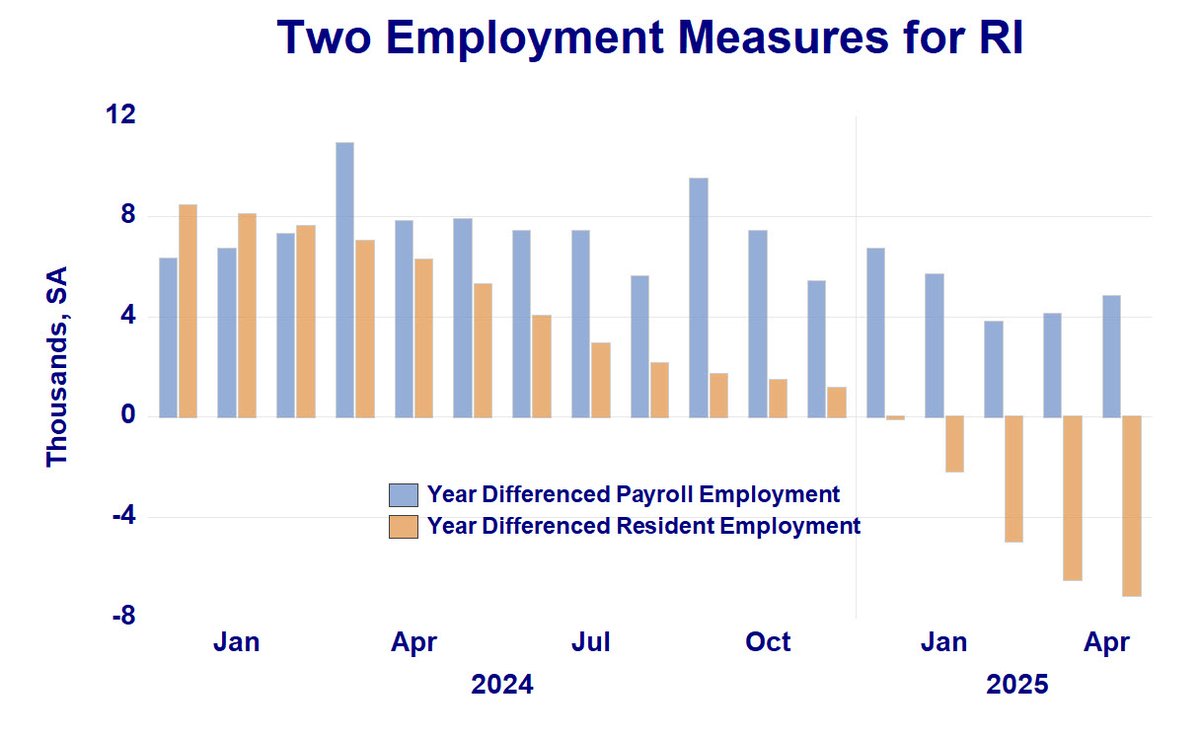
2/ Changes in the two RI employment measures had diverged, with resident employment falling for several months while payroll employment rose. That changed in June as payroll fell. Again, one month only. Eventually, changes in the two series can be expected to converge.
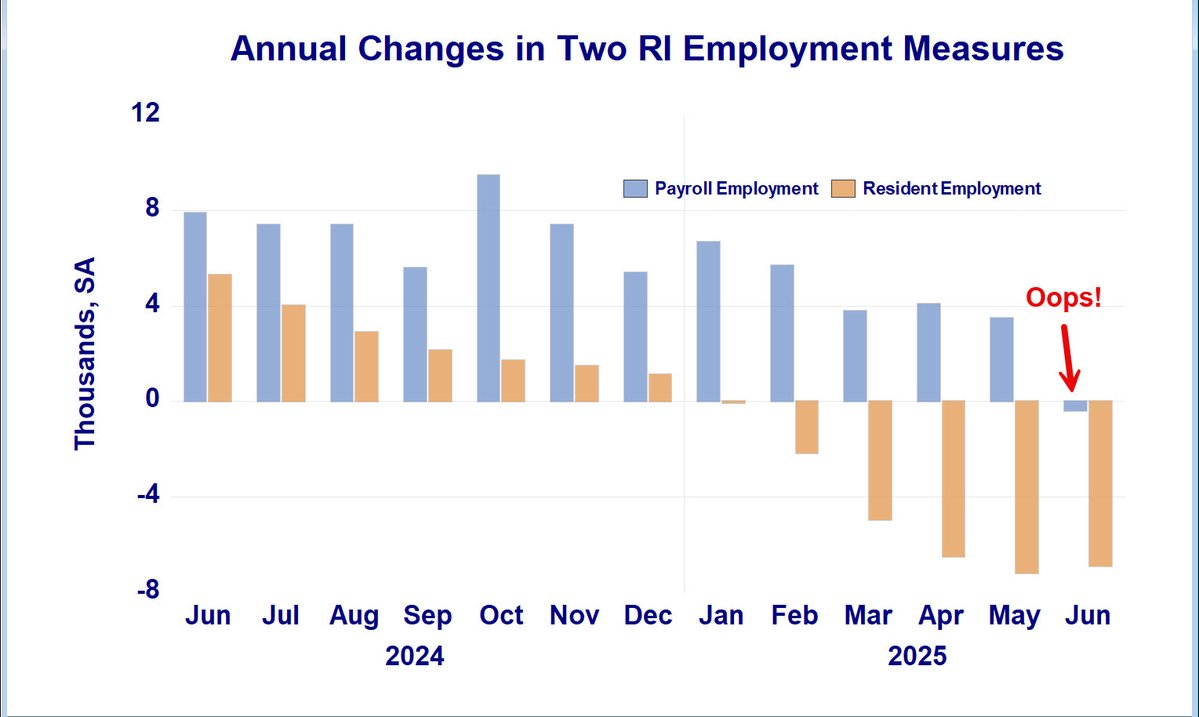
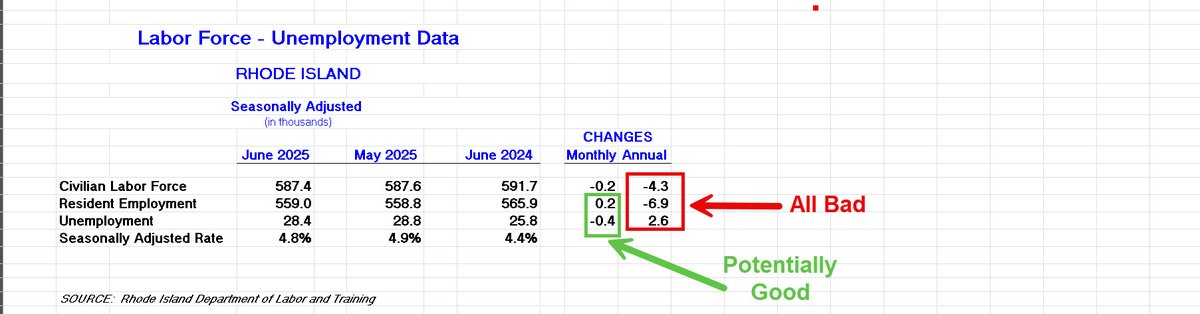
1/ June labor data had a few interesting twists. On an annual basis, all household survey measures remained bad. Monthly, maybe a glimmer of hope, as resident employment squeaked out a slight gain (+200), while still falling annually. This bears watching.
2/ Couple this with the question of seasonal adjustment effects on the recent trend in RI payroll employment (recent post), and things aren't as rosy as a cursory examination of payroll employment data would suggest.
1/ Another perspective on RI payroll employment: Private sector vs. government. Private sector employment growth has been slowing. Since September 2023, it has largely been below that of the government sector.

3/ RI's Q1 growth was aided by construction and durable goods production.
2/ For all of 2024, RI's growth rate of +3.2% was tied for the highest rate in New England with New Hampshire.
1/ RI economic growth went negative in Q1, consistent with what my Current Conditions Index had shown. 2024Q4 growth +1.9%, Q1 at -0.2%. Ironically, this gave RI a Q1 national ranking of 16. All of the New England states experienced declines in Q1 growth.
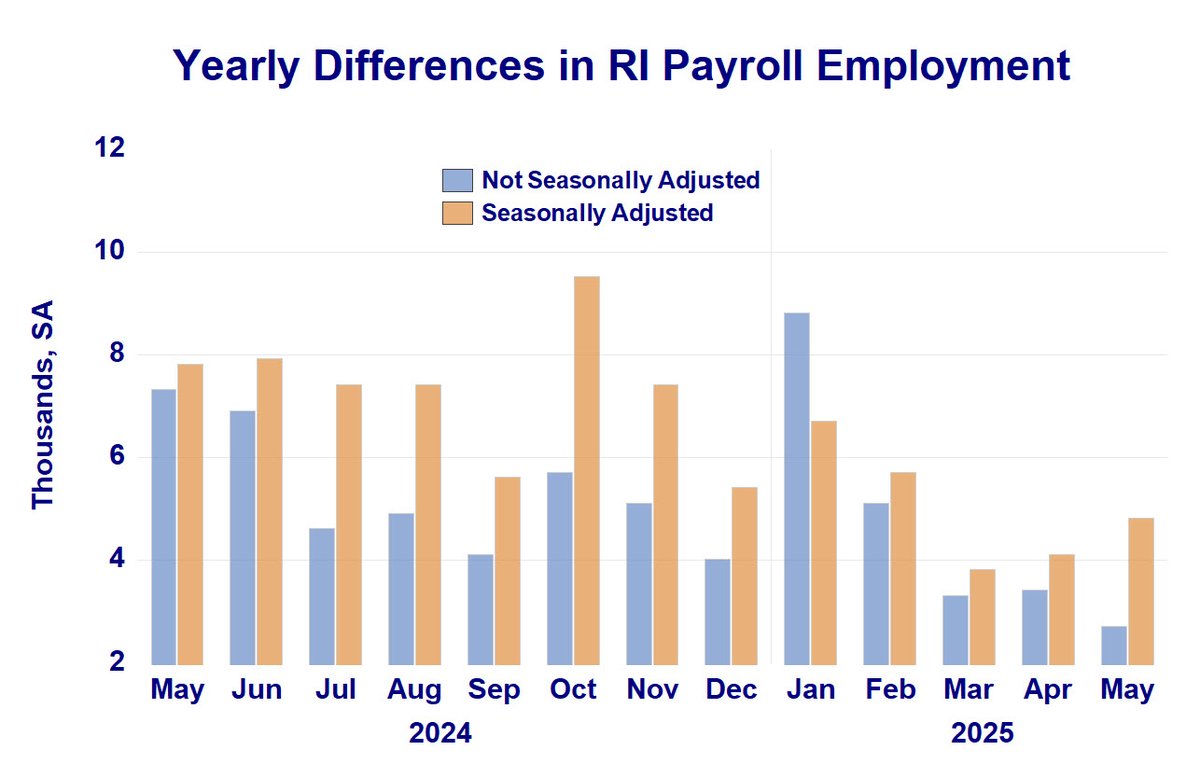
2/ So, part of the divergence between the two employment series is related to seasonal adjustment (possibly residual seasonality). This promises to make the annual labor data revisions more interesting than usual.
1/ RI Payroll Employment has been rising while resident employment has been falling. An interesting difference for payroll employment: Not seasonally adjusted annual changes have been smaller and have fallen since January, the opposite of that for the seasonally adjusted data.
4/ So the questions are: To what extent is our labor force decline related to national immigration enforcement, and how much is the result of BLS deriving RI estimates from its national model? The US data also has a weakening labor force.
3/ The May divergence between the two surveys has become extremely large: Payroll employment +4,800 and resident employment -7,100, which is as large a divergence as has been seen for quite a while. These will eventually move closer, but which will prove to be correct?
2/ Payroll employment, the number of RI jobs, appears to be reasonably strong, rising by 4,800 relative to last April. That data shows no obvious sign of decline.
1/ The divergence in the two labor market surveys continues for RI. Household survey data, with resident employment and the unemployment rate, are still very disappointing. There is no longer any excuse for our state's high jobless rate.

Unlike the US, where continuing UI claims are rising, but layoffs are "tame," for RI, higher continuing UI claims are accompanied by a clear uptrend in initial claims. So, at present, in RI, it's difficult to find a job, AND layoffs are rising.

What the Washington Bridge will end up costing is yet another vivid illustration of the "Rule of 2" I have been proposing since back in the days of debating Providence Place. For any project, whatever they say the costs are, double them. Revenue? Half it. Only in RI!
2/ Another element of labor market weakness is UI Benefit Exhaustions, which were 176% higher than their 2022 low. Both charts, which are not survey-based, show ongoing and intensifying labor market weakness and make me question the accuracy of the payroll employment survey.

1/ Mounting evidence of the accuracy of RI's unemployment rate increases and its deteriorating labor market continues. Looking at Continuing UI Claims, the trend is clearly upward, 68.4% higher in April than its 2022 low, which casts doubt on payroll employment survey strength.
