Jeffrey Heer
@jeffrey_heer
UW Computer Science Professor. Data, visualization & interaction. he/him. @uwdata @uwdub @vega_vis ex-@trifacta
Excited to share our #datavis notebook curriculum for learning visualization! Visual encoding, data transformation, interaction, maps, & more! Into Python? Here's Altair + Jupyter: github.com/uwdata/visuali… Prefer JavaScript? See Vega-Lite + @observablehq: observablehq.com/collection/@uw…

With DracoGPT, Will Wang shows how to extract and model visualization design preferences from generative AI systems — enabling new ways to quantify, evaluate, and efficiently reuse LLM-based chart recommendations. #ieeevis idl.uw.edu/papers/dracogpt
Congrats Dominik!
Congratulations to IDL alum @domoritz for winning a VGTC Significant New Researcher award!! A premier honor for early career researchers in visualization!
Congratulations to IDL alum @domoritz for winning a VGTC Significant New Researcher award!! A premier honor for early career researchers in visualization!
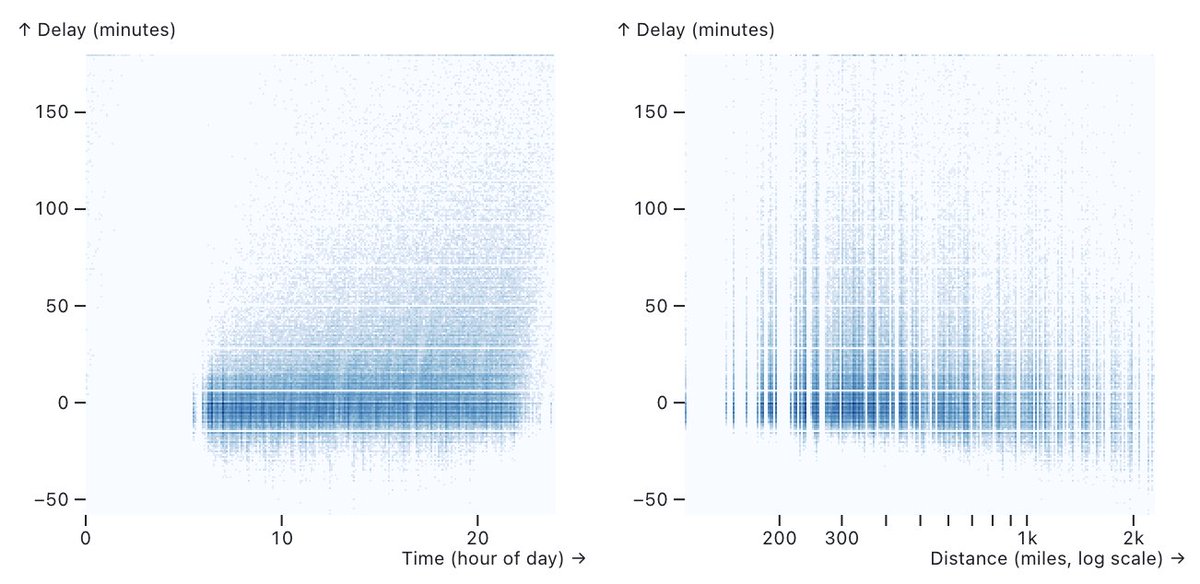
Mosaic is the future of data visualization. 10M cross-filtered rows with client-side processing. Powered by @duckdb
🚀 New Benchmark Alert: ⚙️ BLADE — A benchmark with expert-annotated analyses, evaluating how #LLM agents tackle open-ended, data-driven scientific research questions. Results show top models reach only ~44% F1. 📄 arxiv.org/abs/2408.09667 👨🏻💻 github.com/behavioral-dat… 🧵1/9
I'm super happy that @_hex_tech donated VegaFusion to the Vega org to bring it together with Altair which is also now under the Vega org. It's been amazing to collaborate with @jonmmease and I look forward to continue doing so.
📊 We're donating @vegafusion_io to the @vega_vis community after 2 years of development and stewardship! We feel great about the project and are excited for it to live under the official Vega banner, with the same BSD-3 license we’ve been using hex.tech/blog/donating-…
Frustrated with topic models? Wish emergent concepts were interpretable, steerable, and able to classify new data? Check out our #CHI2024 talk on Tues 9:45am in 316C (Politics of Datasets)! Or try LLooM, our open-sourced tool :) ✨ github.com/michelle123lam…
“Can we get a new text analysis tool?” “No—we have Topic Model at home” Topic Model at home: outputs vague keywords; needs constant parameter fiddling🫠 Is there a better way? We introduce LLooM, a concept induction tool to explore text data in terms of interpretable concepts🧵
Chaining LLM calls can improve output quality, but navigating the massive space of task decompositions is challenging. Revisiting the established field of crowdsourcing, we distill strategies for effective LLM chain design and identify opportunities for future research. [1/11]
Excited to analyze text at the level of *interpretable concepts*, addressing many weaknesses of topic models we’ve found in the past - and with more control & revision by analysts. Also a fun collaboration between @uwdata and @StanfordHCI, led by the impressive @michelle123lam!
“Can we get a new text analysis tool?” “No—we have Topic Model at home” Topic Model at home: outputs vague keywords; needs constant parameter fiddling🫠 Is there a better way? We introduce LLooM, a concept induction tool to explore text data in terms of interpretable concepts🧵
“Can we get a new text analysis tool?” “No—we have Topic Model at home” Topic Model at home: outputs vague keywords; needs constant parameter fiddling🫠 Is there a better way? We introduce LLooM, a concept induction tool to explore text data in terms of interpretable concepts🧵
The Vega Project is happy to announce the release of version 5.3.0 of the Vega-Altair Python visualization library. This release has been 4 months in the making and includes enhancements, fixes, and documentation improvements from 11 contributors. Highlights in 🧵
Observable Framework 1.3 🆕 integrates @uwdata’s Mosaic vgplot, which can concisely expressive performant coordinated views of millions of data points. observablehq.com/framework/lib/…
I've always been excited about the hybrid client/server execution model in @motherduck but seeing how well the WebAssembly client works with @uwdata Mosaic is even more exciting. In the video below I am looking at 10m data points in my browser.
If you’re excited about Observable Framework’s new SQL cells, wait till you see our Mosaic integration! The code: --- sql: gaia: ./gaia-sample.parquet --- # Hello, vgplot ```js echo vg.plot(vg.raster(vg.from("gaia"), {x: "ra", y: "dec", fill: "density"})) ```
I've had fun playing with @observablehq Framework to deploy dashboards and web apps. Here's an example site integrating @uwdata Mosaic and @DuckDB for scalable visualization: uwdata.github.io/mosaic-framewo…