
Grafana
@grafana
Open and composable observability. Join the Grafana community 👇
📣 #ObservabilityCON 2025 registration tickets are now on sale and we're offering a 50% discount for a limited time! Join us to learn how to leverage Grafana Cloud as a complete, AI-powered observability solution. Leave with the strategy and skills to drive real business…


🔔 Getting started with Grafana Alerting? This new step-by-step video shows you how to create and receive your first alert: youtu.be/YVhKNbQNNss

📣 Exciting news! We've partnered with @Tailscale on a new integration. Now you can effortlessly query data sources on your tailnet directly from your Grafana Cloud stack using Private Data Source Connect. grafana.com/blog/2025/07/2…
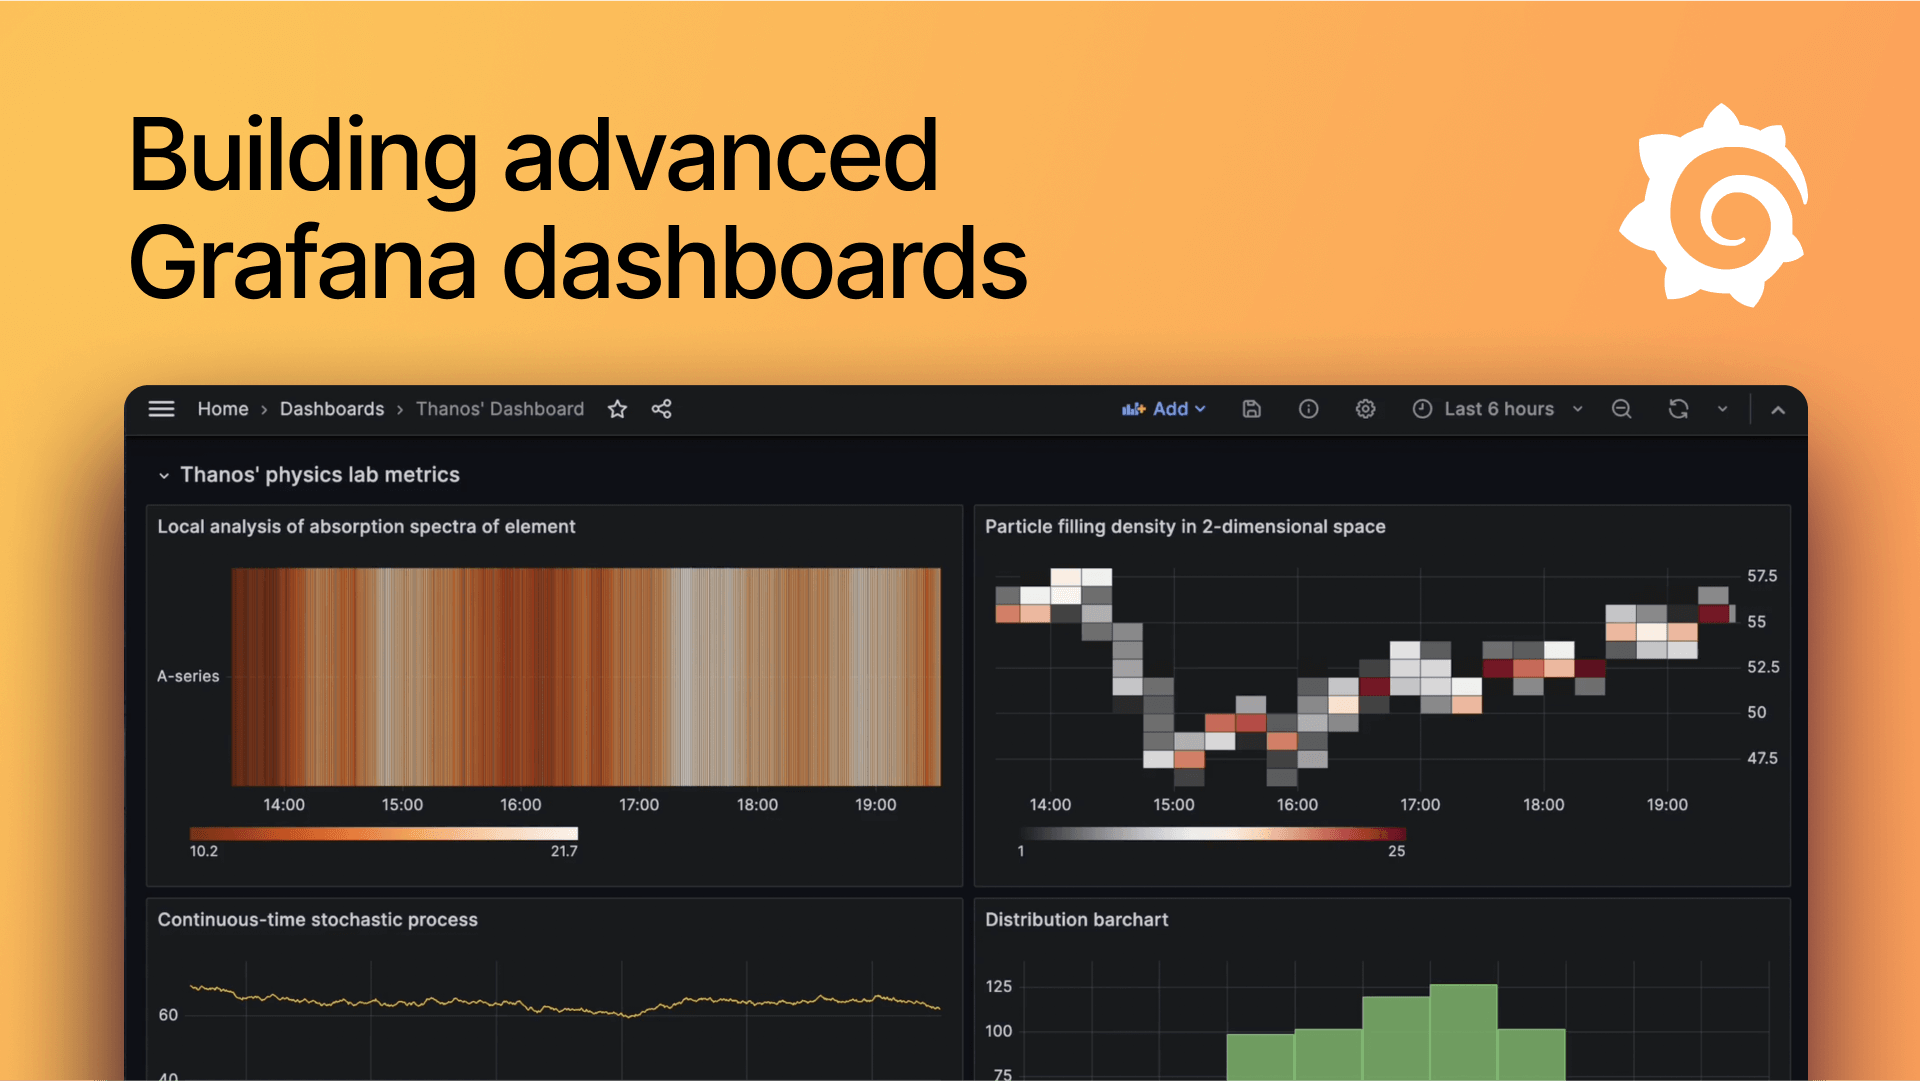
📞 Your dashboards called. They want an upgrade. Join us on July 30 to give your dashboards a little extra sparkle. We'll cover: 🪄 Advanced variables and dynamic panels 📈 Smarter layouts for scale & performance 🤩 Practical design tricks grafana.com/go/webinar/bui…
💡Join our tomorrows @grafana Campfire🔥Community Call where we will talk about the Grafana MCP Server as how to integrate it into your work environment and learn more from our experts🚀 youtube.com/watch?v=6b94to… #grafana #opensource #community #mcp
☁️ From deeper insights in #Kubernetes Monitoring to a new auto-apply feature in Adaptive Metrics, here are some of the latest and greatest features available in Grafana Cloud. grafana.com/blog/2025/07/2…
🔭 Open source has always been core to what we do — which is why we continue to go all in on #OpenTelemetry. In this blog, we reflect on what’s top of mind for us when it comes to the project, and how we continue to invest in the OTel community. grafana.com/blog/2025/07/2…
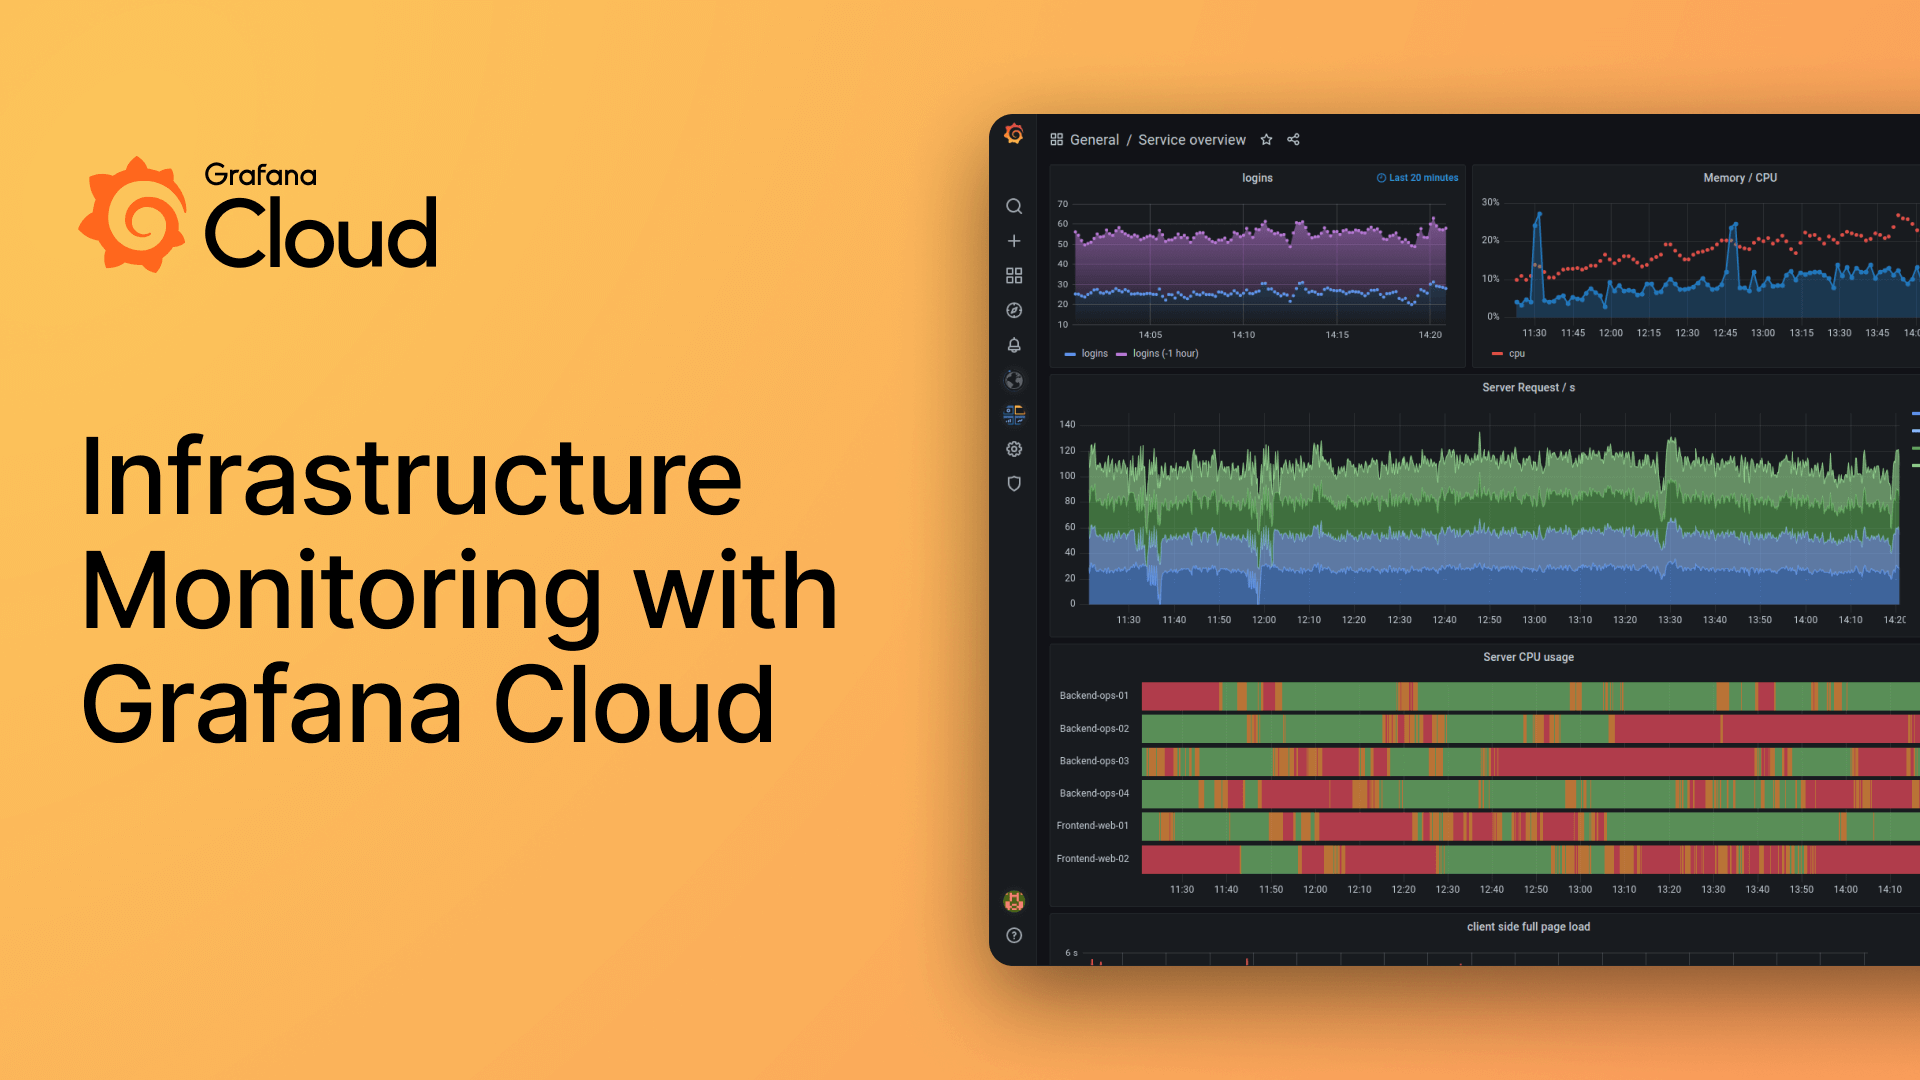
Our cloud infrastructure monitoring webinar starts in 1 hour! Learn about: - The nuances in observing cloud service models - Strategies for monitoring across multiple cloud providers #OpenTelemetry benefits for consistent observability grafana.com/go/webinar/clo…
We’ve learned so much building Grafana Assistant. @Kuqd and I are going to start writing, speaking, sharing more. We built the assistant in typescript and it runs entirely* in the browser. So it’s built into Grafana’s UI. This lets us do things other agents can’t. (Thread)
Building the Grafana Assistant has been so much fun. Loads of learning we've made along the ways with a world class team. We're hiring !
We’ve learned so much building Grafana Assistant. @Kuqd and I are going to start writing, speaking, sharing more. We built the assistant in typescript and it runs entirely* in the browser. So it’s built into Grafana’s UI. This lets us do things other agents can’t. (Thread)
If Grafana chart flickered yellow while no one was watching… did latency truly spike?
Senior DevOps engineer in 2025
Observability is expanding dynamically, broadening how organizations can leverage it for a variety of reasons. By @bcamerongain feat. @grafana CTO @tom_wilkie thenewstack.io/grafanas-cto-o…
"If Grafana chart flickered yellow while no one was watching, did the latency truly spike?"
Interview with Senior DevOps engineer 2025 [FULL]
Hey San Francisco! 👋 Join us for a free, hands-on workshop on to learn how to monitor your #AWS Infrastructure using #Grafana Cloud: events.grafana.com/2025-07-30-int… After the workshop, follow us to a networking happy hour at Wayfare Tavern!

🔭 This #Grafana dashboard tracks the @Space_Station, including its current location, sighting opportunities, and information about the crew on board. Congratulations to Ruben Fernandez on this 2025 Golden Grot award-winning dashboard! #GrafanaEverywhere…
Hey San Francisco! 👋 Join us for a free, hands-on workshop on to learn how to monitor your #AWS Infrastructure using #Grafana Cloud: events.grafana.com/2025-07-30-int… After the workshop, follow us to a networking happy hour at Wayfare Tavern!
