Buy the Dip
@beeteeceeee
Charts are my hobby not financial advice .

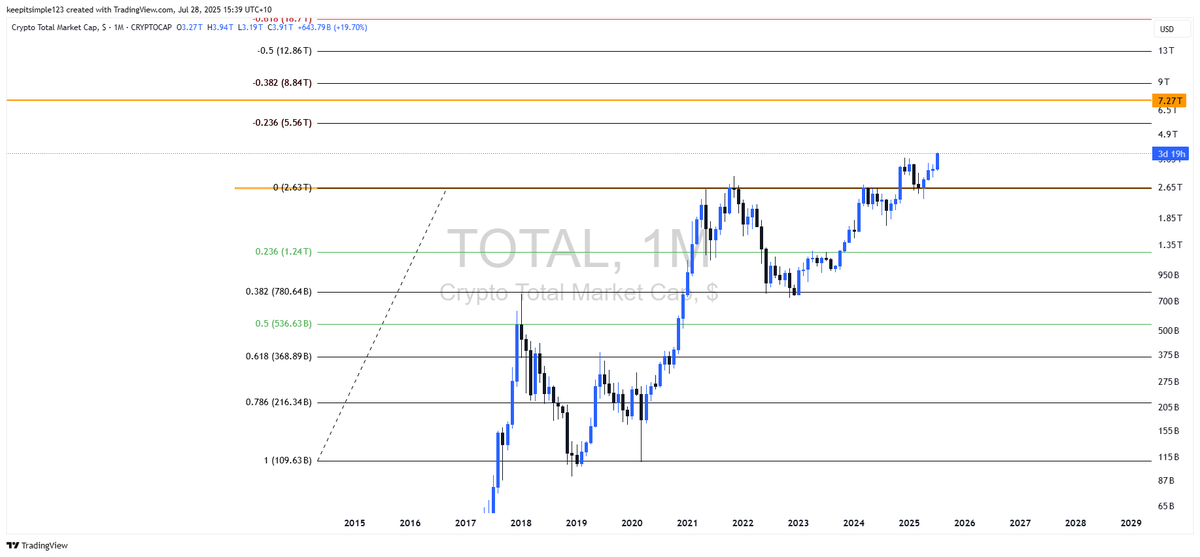
TOTAL to breakout to new ATHs in next 24 hour based on this 30 minute chart . It checked in with the Golden pocket and is tapping at resistance

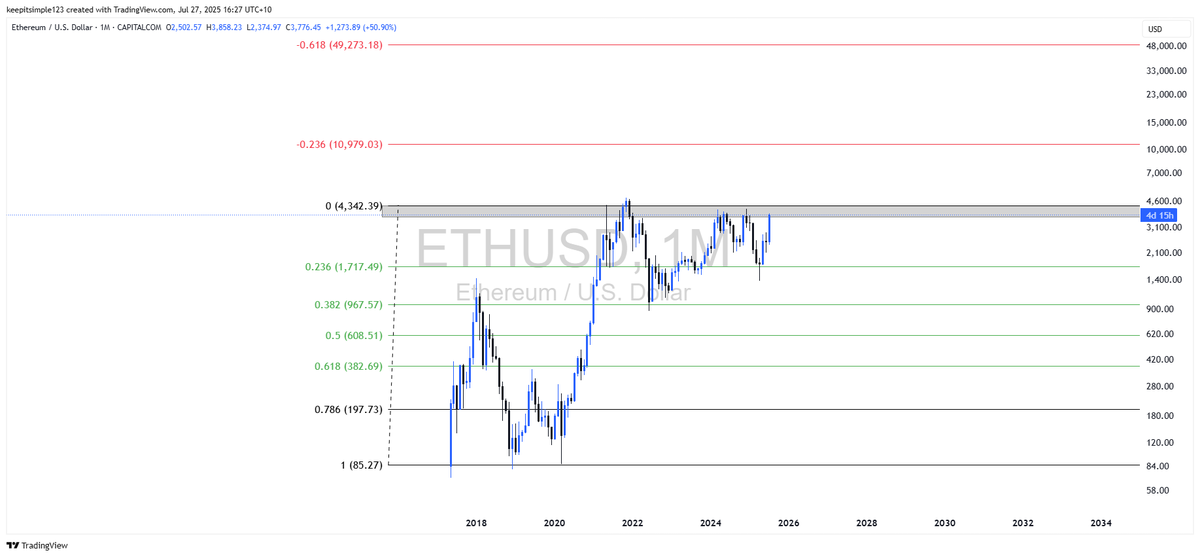
ETH to 11K Broadly speaking ETH is exhibiting bullish behaviour in terms of continous tapping of intra year resistance between 3500 to 4300 . 11,000 in play by the math Its basically a 4 year accumalation structure under resistance Figures plucked out of thin air for ETH I…
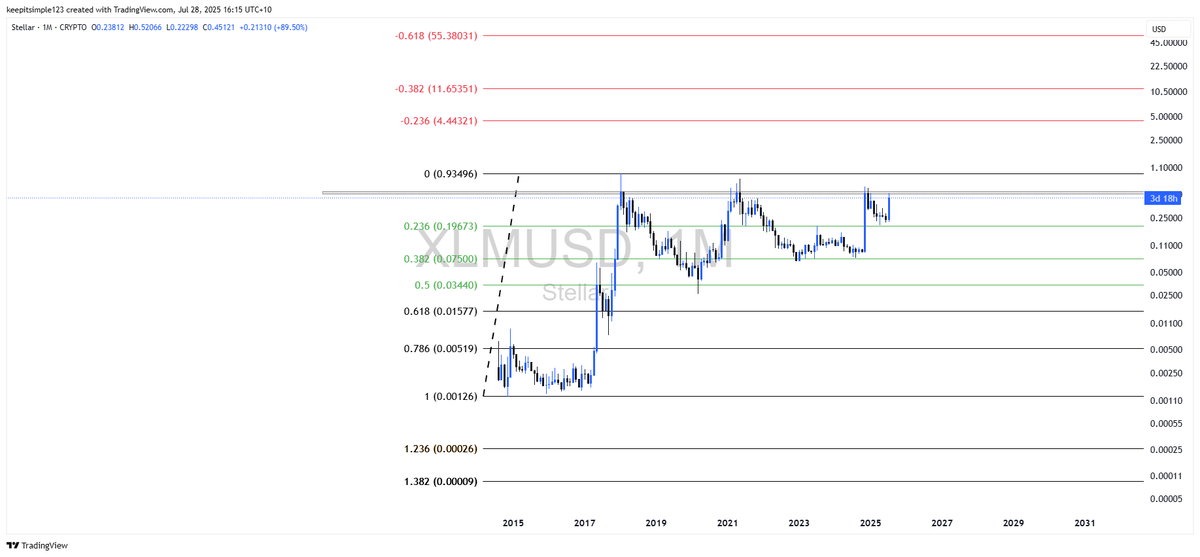
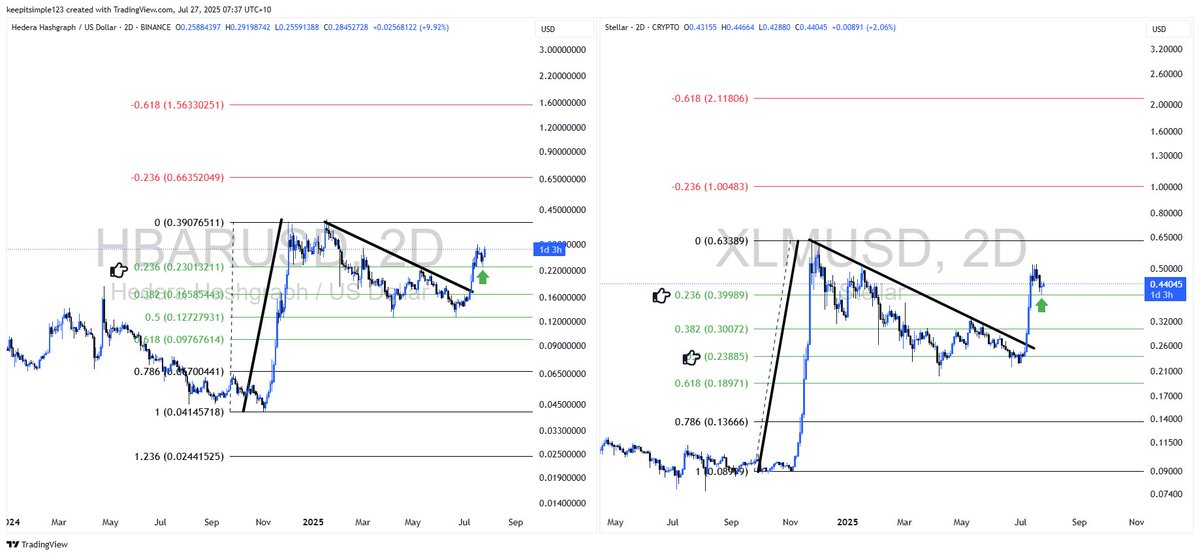
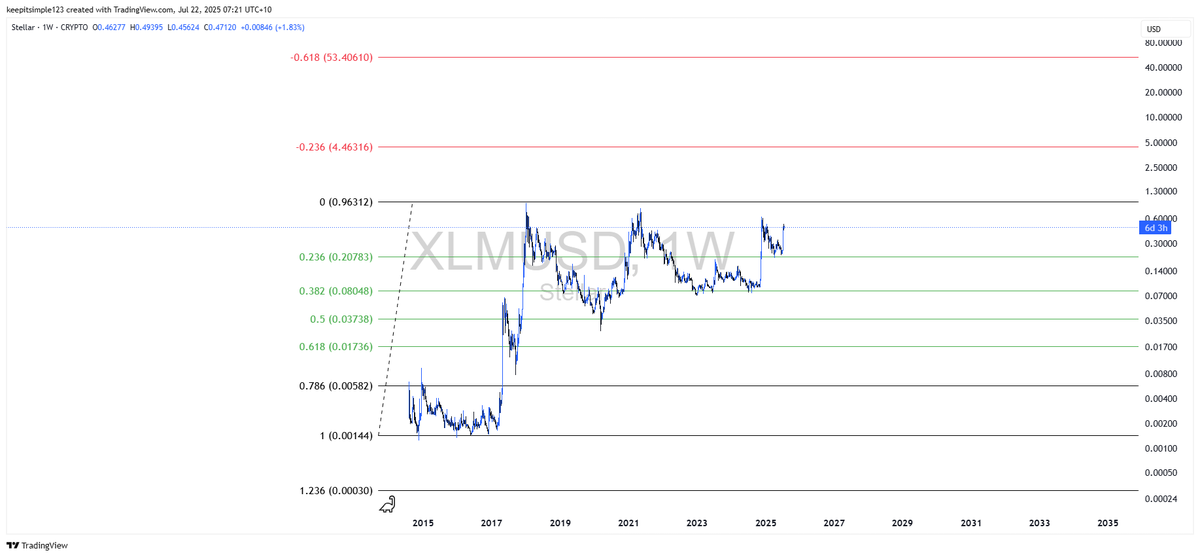
XLM needs a good rest but then when it breaks that multiyear resistance its big time No reason 4.44 is not on the cards
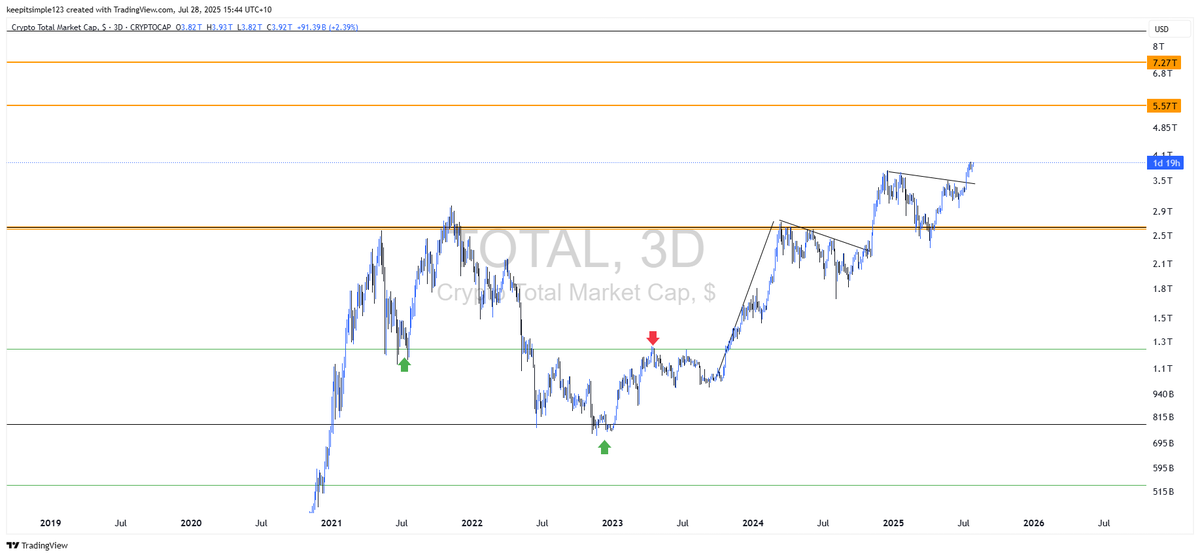
There shoud be no confusion TOTAL is the most simple technically erfect chart around . Obeying all fibs , divs and Cup and Handle bullish retest TOTAL broke out of 4 year resistance as T got elected and simply retested the breakout in April . Basic simple stuff This chart is…

Adapt and prosper
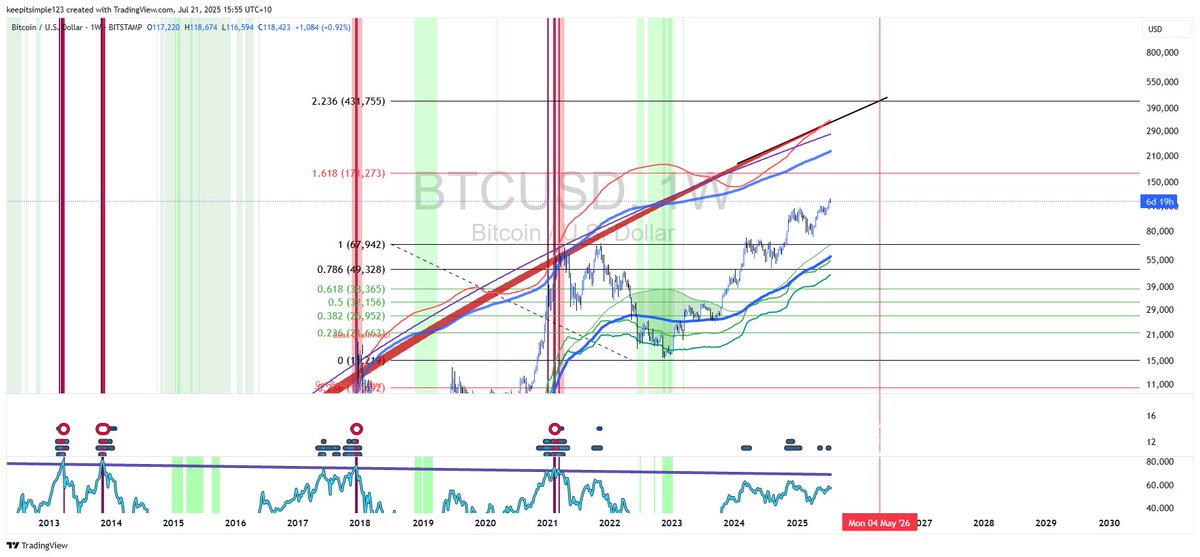
BTC/USD looks like two entirely different assets before and after the ETF The days of parabolic bull markets and devastating bear markets are over BTC is going to $1,000,000 over the next 10 years through a consistent oscillation between “pump” and “consolidate" It will bore…
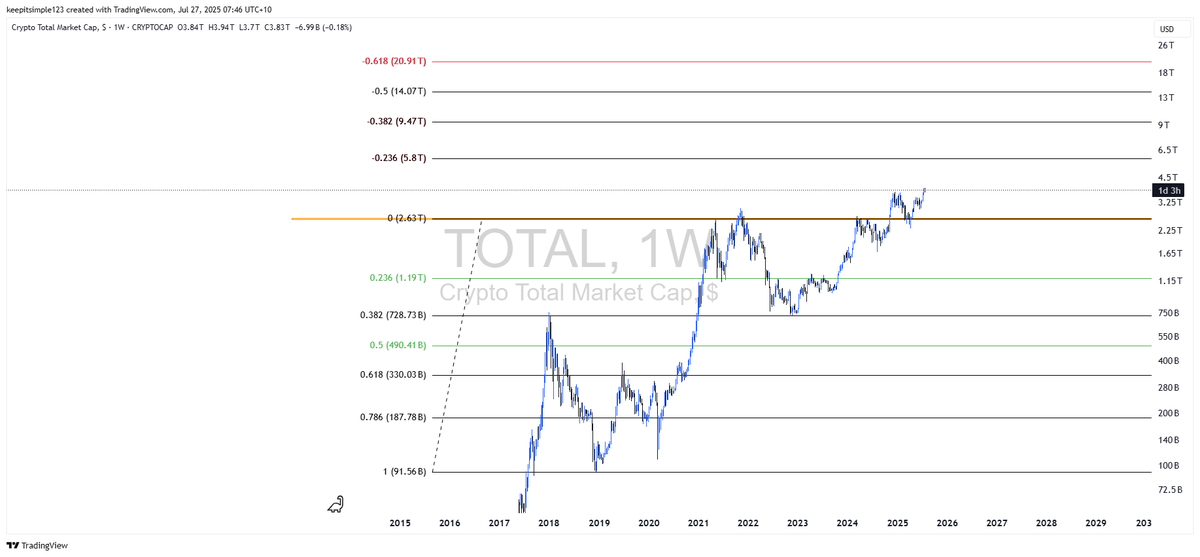
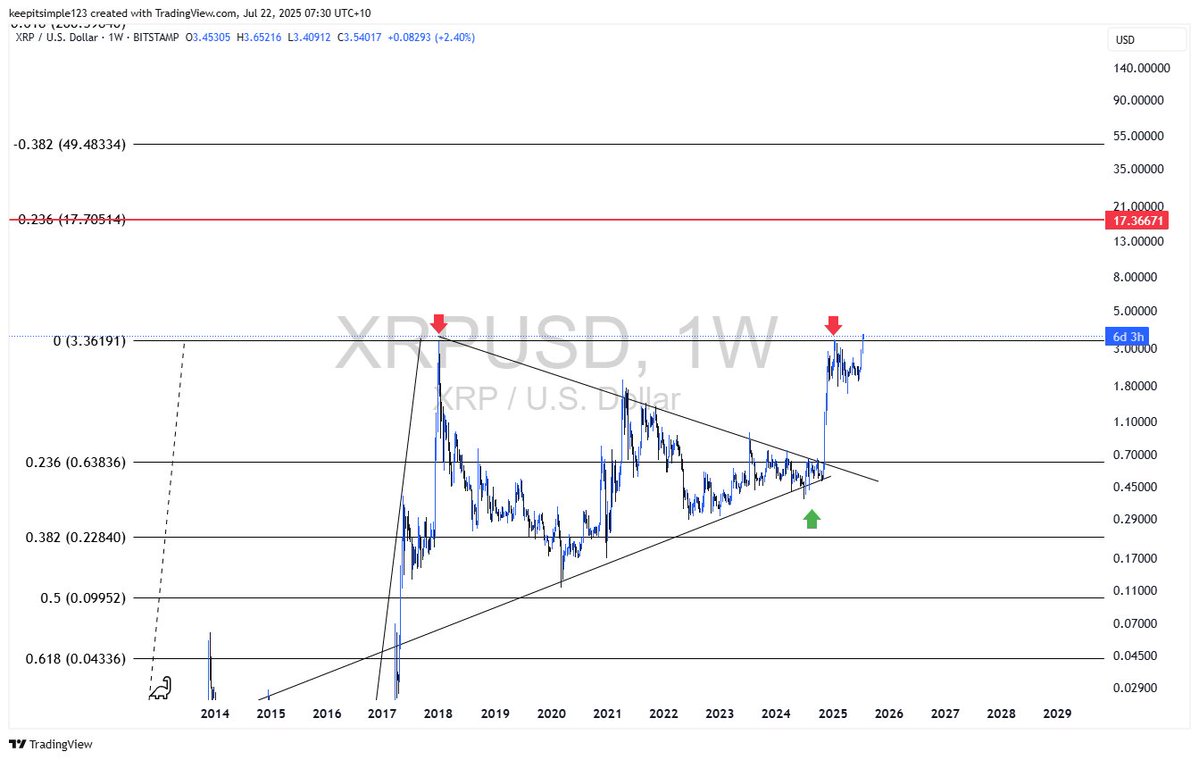
1. The two great bullflags of XLM and HBAR Which we followed for months Textbook breakouts and both retesting the .236 fib for support Targets are in red . Targets in red should be confluent with bearish divergence 2. I have also included for the TOTAL chart Profit taking…
IBTC . Rejected the .236 massively You might wonder why I use fibs all the time This is why

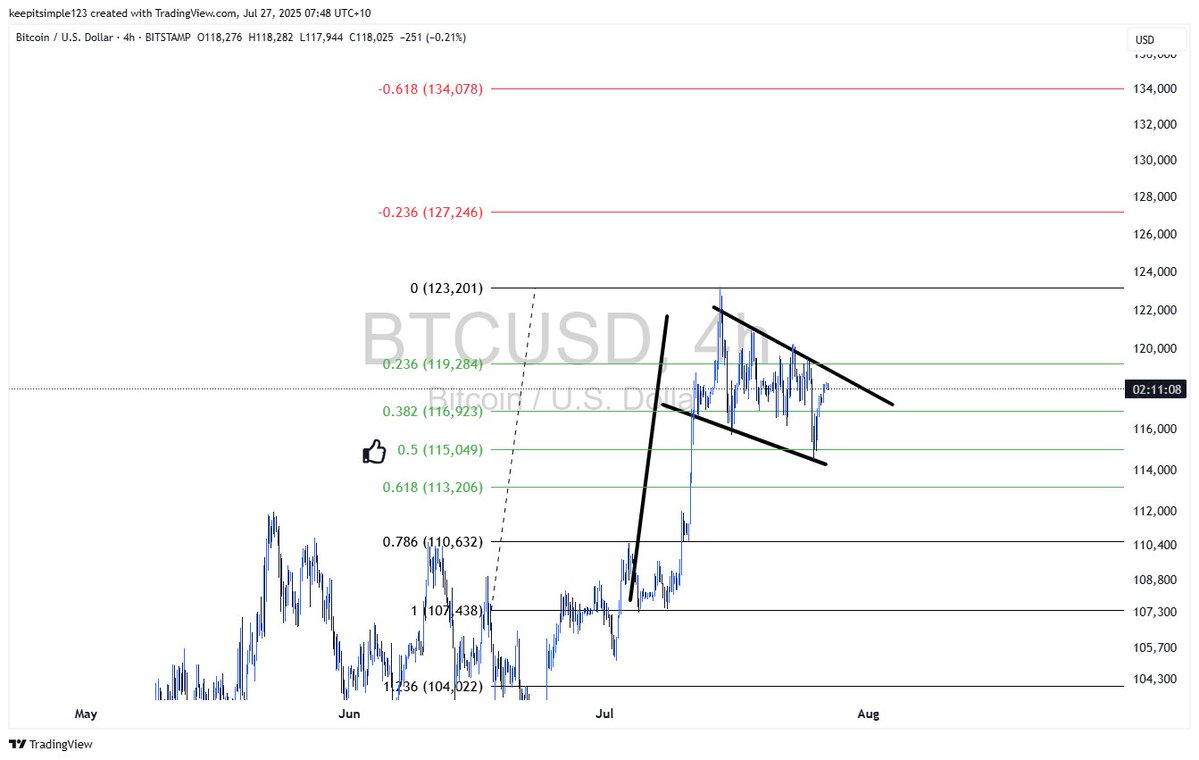
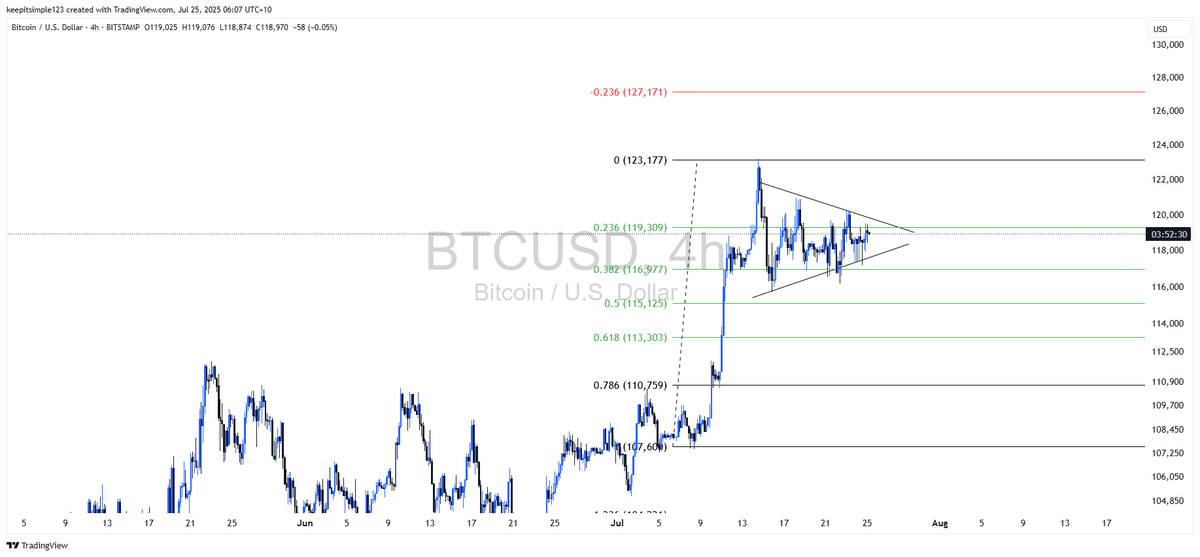
My first impression of BTC on the 4 hour this morning is a Bull pennant Seems to respect the fibs as well
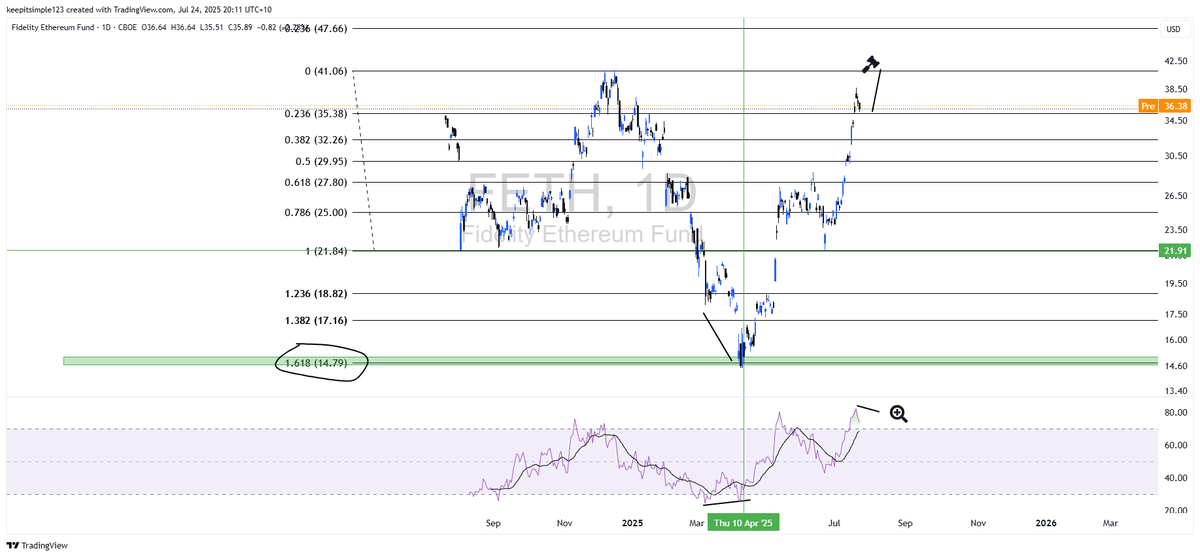
People getting bullish on ETH April was that time Not now Now it is important to watch for bear div at resistance on FETH Headwinds for ALTS Could be , yes . Ideal situation would be for FETH to flag out under ATHs and let the RSI cool
Eventually it bites Watching for a base of some kind to form for further upside
Bearish divergence does not care one jot about news XLM
Past present and future in one simple chart But you rarely if ever see it TOTAL with one indicator and a Fibonacci Successful breakout of Cup and Handle pattern gave US regulation . I would wager one of the fibs shown will be a market peak for ALTS and BTC

Called the bottom on ETH in April but would now be cautious with regard to previous ATHs on FETH until cleared The Fidelity ETH ETF is a simple way to see ETH pa
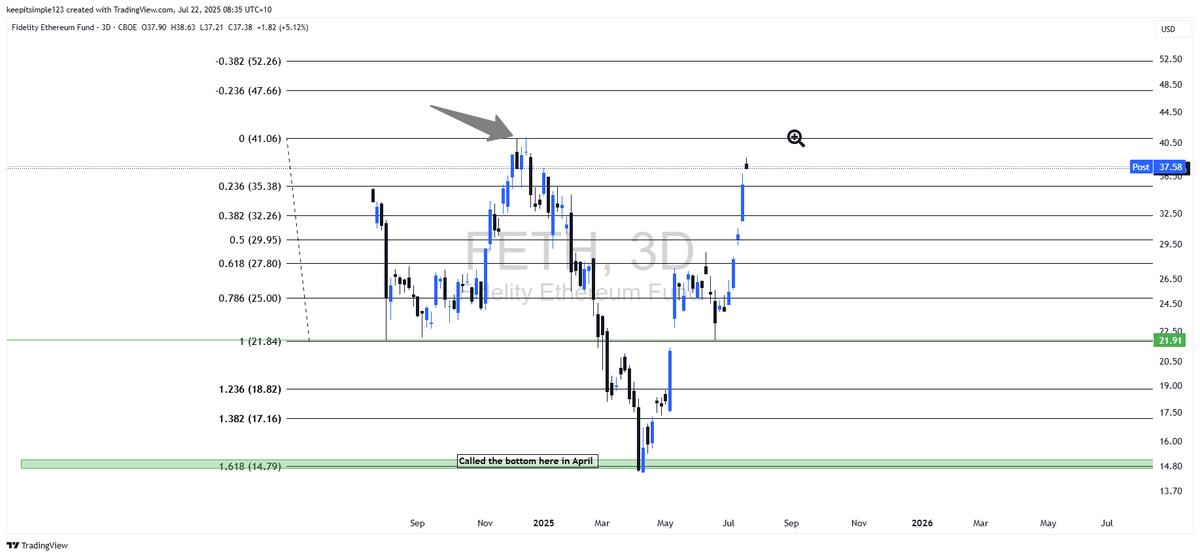
OK so far Area marked is where I think market takes a breather /correction Always keep a eye on the exit when you are in the casino

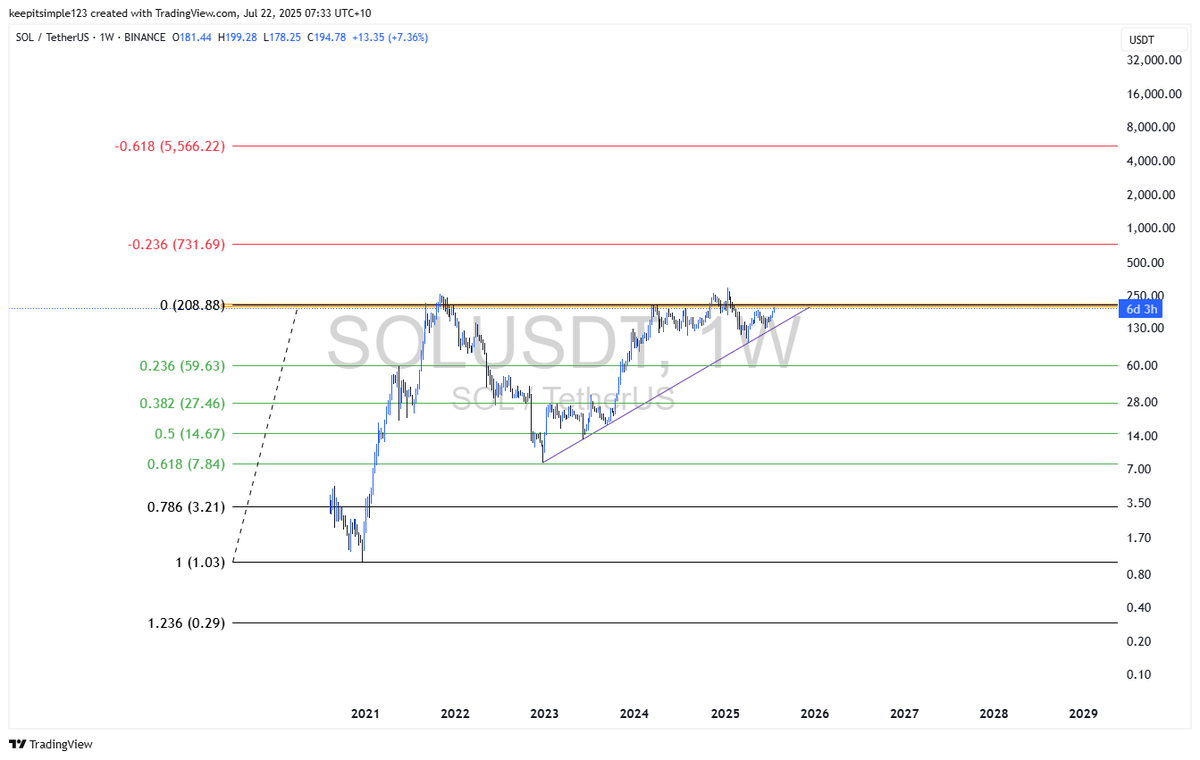
With regard to ALTS over the last number of months I focused on HBAR , XLM , XRP , SOL and highlighted the DOGE and LINK BTC charts XLM What I like about it is the massive base which very closely resembles a Adam and Eve bullish pattern or one could make some kind of pennant…
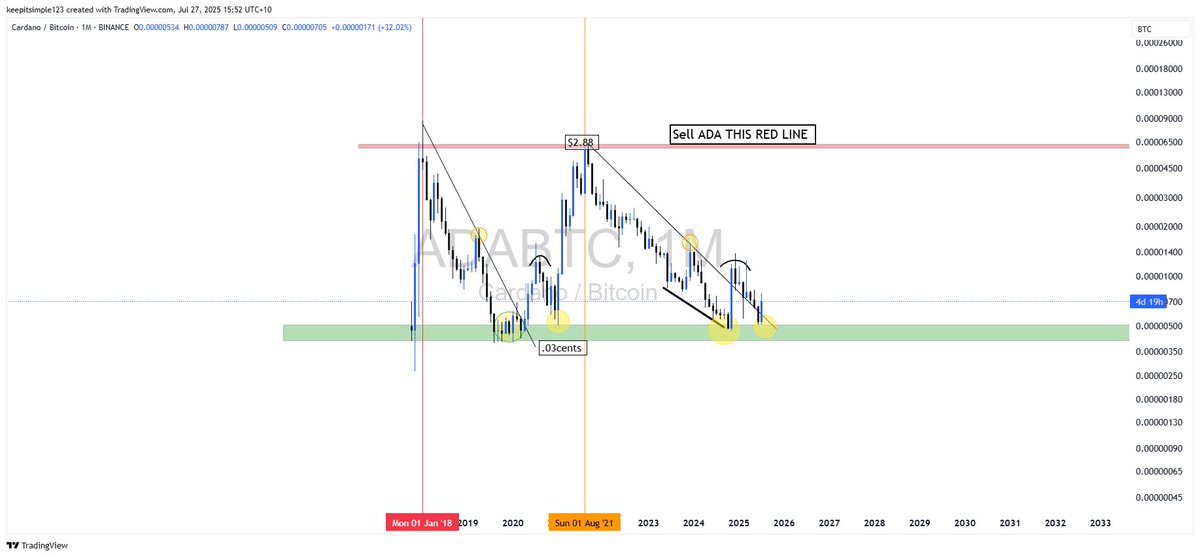
The fib at 434 K has been hit every other prior impulse Do with that what you will Selling in a Bull is one of the most counter intuitive things you will ever do besides getting married 😅