Zack Labe
@ZLabe
Climate Scientist at @ClimateCentral | PhD | Views, thoughts, and opinions expressed are only my own ----- now posting on Bluesky -----
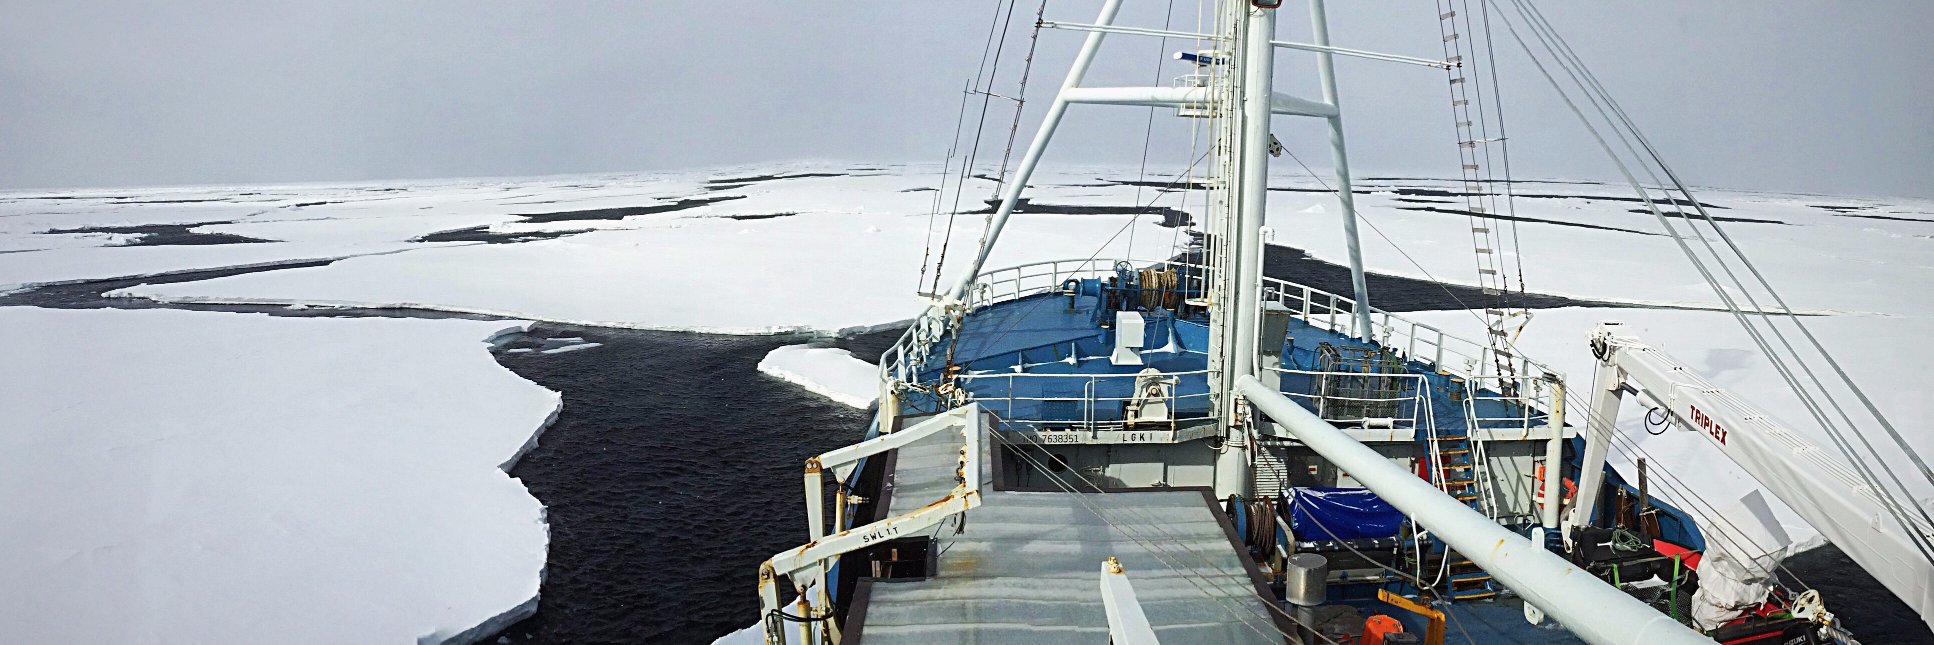
Looking for polar climate visualizations? Start here: 📈📉 + Arctic sea-ice extent: zacklabe.com/arctic-sea-ice… + Arctic sea-ice thickness/volume: zacklabe.com/arctic-sea-ice… + Arctic temperatures: zacklabe.com/arctic-tempera… + Antarctic sea ice: zacklabe.com/antarctic-sea-…
As hot as this summer is, it’s one of the coolest we’ll ever experience again, says @markgongloff ☀️🎥 Read the column: bloom.bg/4k3bKxF
Climate researcher Zack Labe was one of hundreds of scientists laid off at #NOAA by DOGE this year. He believes we're at a tipping point and that "there could be a complete gap in the next generation of scientists." highnorthnews.com/en/us-climate-…
🗣️"Across Norway, unusually warm, tropical-like days and nights have persisted for weeks, creating new challenges for northern communities unaccustomed to such prolonged heat." - Zack Labe, Climate Scientist 🧵/3
Join us tomorrow for the next session in our communication training series! Hear from climate scientist Zachary Labe and Kristy Drutman, founder of Browngirl Green, about using social media, building an online presence, and navigating misinformation. 👉 bit.ly/CCTraining25
I just posted a new 'climate viz of the month' blog, which highlights a simple method of visualizing regional temperature departures: zacklabe.com/climate-viz-of… #SciComm #DataViz #OpenScience #OpenData #ClimateChange #ClimateScience

I'd like to introduce a new page on my website: U.S. climate indicator visuals: zacklabe.com/united-states-…) I only have a few basic variables so far, but I will be expanding this summer to add a range of metrics (e.g., ecological). Hope this is useful, and you are welcome to share.

The Trump administration is proposing that NOAA reduce its annual budget by $1.8 billion and fire 2,000 full-time employees. That includes the closure of a laboratory in Princeton, a staple of weather forecasting and climate modeling since 1955. ow.ly/3i8w50WkKjf
Occasional reminder where you can find all of my weather/climate posts and data viz: #ClimateChange #SciComm + (primary, daily updates) bsky.app/profile/zackla… + (website) zacklabe.com + linkedin.com/in/zacharylabe/ + fediscience.org/@ZLabe + buymeacoffee.com/zacklabe

🌡️HEAT ADVISORY in effect for parts of Northern Alaska through 10pm AKDT -- particularly in the Plains near Umiat. @NWSFairbanks is forecasting high temperatures 80°-90°F. 🔴Excessive, early July, 20°F above average heat is RARE & now 3x to 5x more likely due to climate change
I have a new 'climate viz of the month' blog posted, which dives into a visualization and description of future Arctic sea ice cover: zacklabe.com/climate-viz-of… #SciComm #DataViz #OpenScience #OpenData #ClimateChange

Today is #ShowYourStripes Day 🔵🔴 A single image. A century of data. Every city, state, county -- the planet -- has an impact of climate change story — and the stripes show it. Post yours. Highlight the warming where you live. Start the conversation.
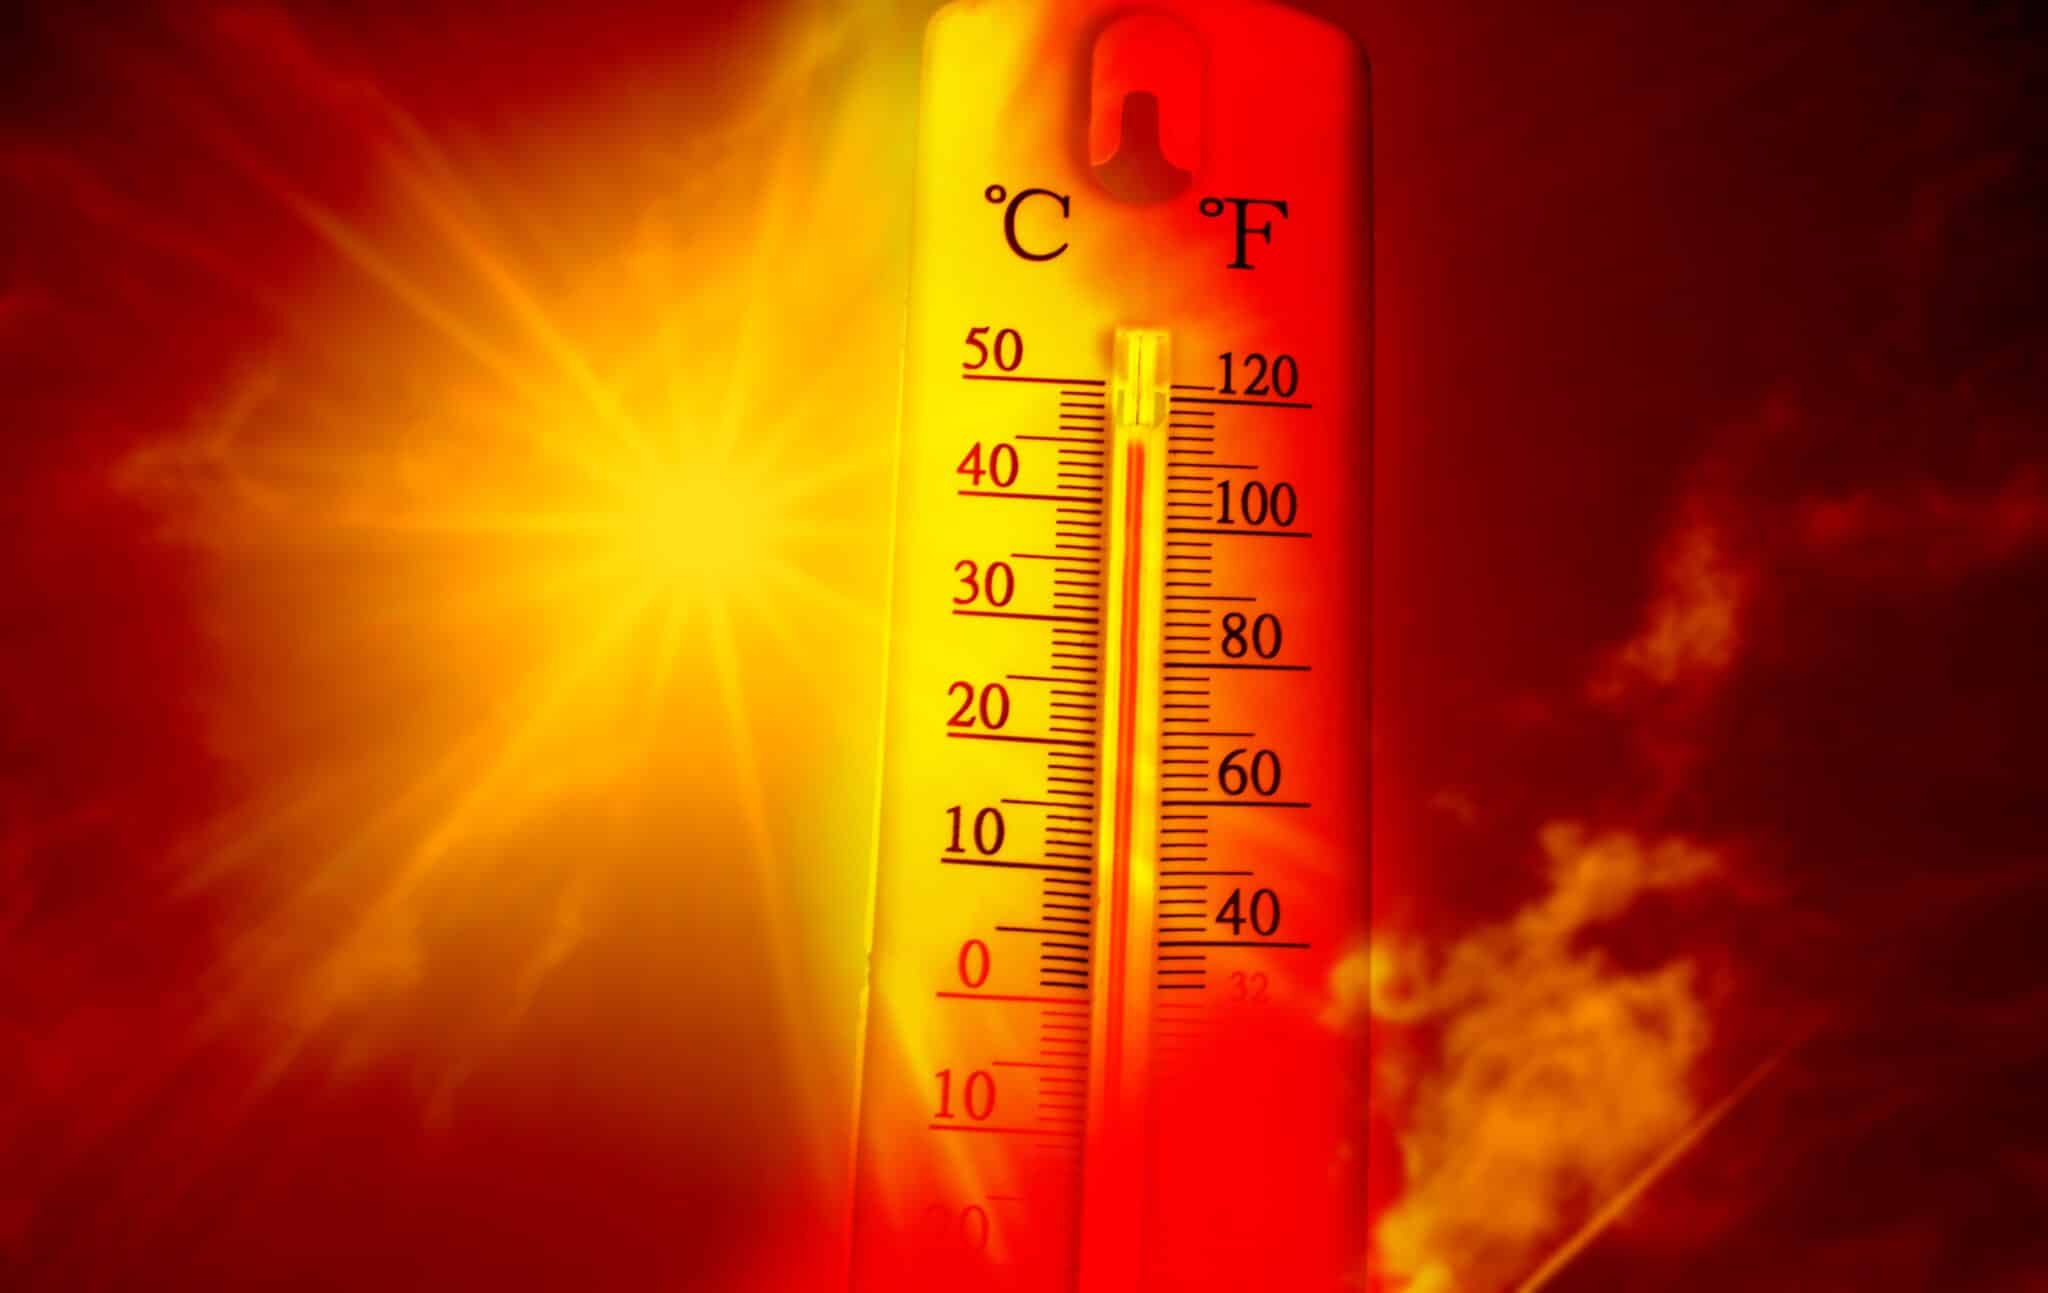
It’s hot. Almost half of the U.S. (around 174 million people!) is being affected by a climate change-driven heat wave expected to last into next week. Human-caused climate change made this extreme heat at least 3 times more likely. Let’s break it down: climatecentral.org/climate-shift-… 1/5
Greenland: Why is the land of ice such a hot topic? 🎧 Listen and subscribe to Ecolution 👇 rte.ie/kids/2025/0618…
📣Update: We’re moving! For continued access to our latest climate news, important announcements, and resources, please follow @NASAEarth. This account will be archived over the coming weeks.
Wherever you live in the world, your climate is getting warmer. Countdown to #ShowYourStripes Day on the 1st day of summer (June 21st): 12 days! Each line represents one year 🔵Cooler-than-average temp 🔴Above-average temp Find your city's stripes👉 observablehq.com/@climatecentra…
📈 Upper-air temperature trends in the northern hemisphere in May – @ZLabe 3️⃣ bsky.app/profile/zackla…
My next 'climate viz of the month' blog is posted and discusses overall changes to #Arctic springtime snow cover: zacklabe.com/climate-viz-of… #DataViz #SciComm #OpenData #OpenScience #OpenAccess

Over the last few weeks, I've added quite a few new data visualizations on my global indicators (zacklabe.com/climate-change…) and polar climate pages (zacklabe.com/arctic-sea-ice…). They will be updated in near-real time, so feel free to share them!
"This new system aims to provide crucial insights within weeks or months of an event, when the information can most effectively guide adaptation strategies and help communities make informed decisions about their future." (studyfinds.org/heat-wave-fuel…) Paper: doi.org/10.1088/2752-5…
My latest 'climate viz of the month' blog is now out and introduces my new timeline of global change (version 1): zacklabe.com/blog-archive-2… #DataViz #SciComm #OpenData #OpenScience