Tom Sawyer Software
@TSawyerSoftware
Global leader in graph and data visualization and analysis technology. Build scalable visualization applications with our software and services. #TSPerspectives
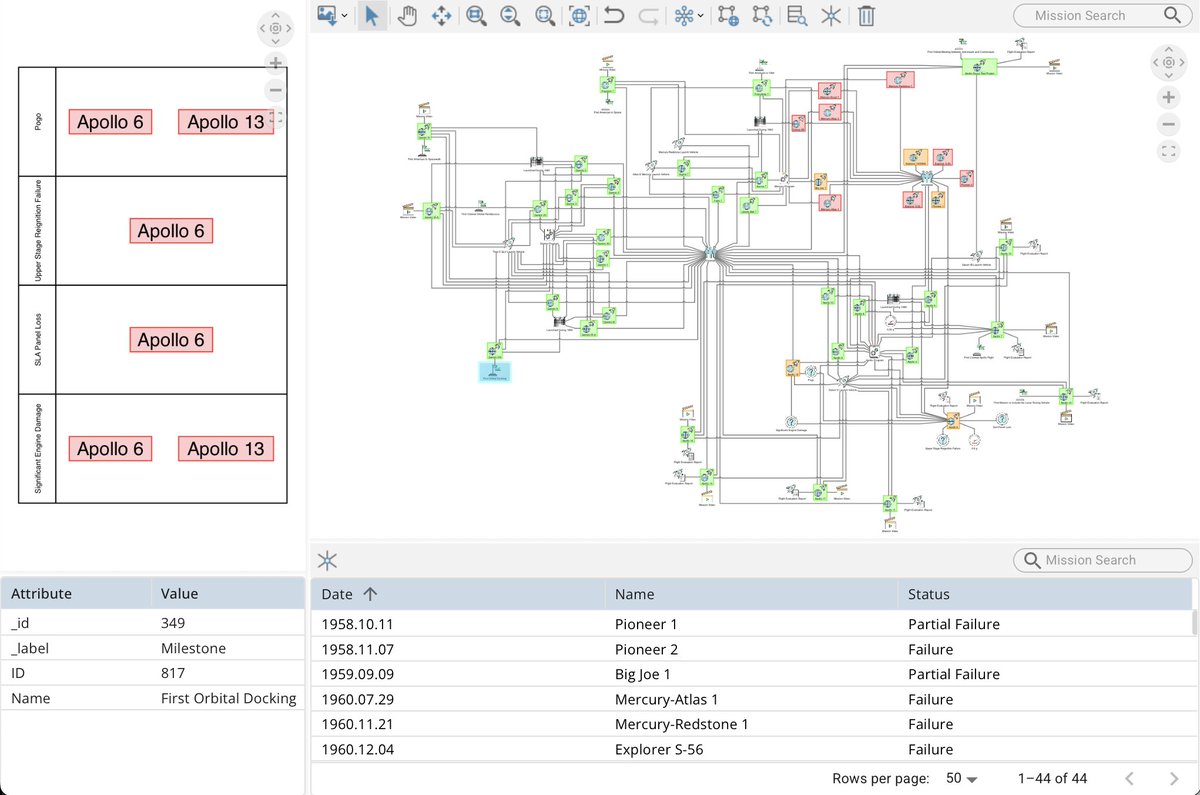
🎤 Don’t miss our two technical sessions at INCOSE IS 2025—where we explore how graph-based approaches are reshaping systems engineering. 📅 July 28, 10:45AM | Room 214 "A Knowledge Graph Framework for Failure Analysis and Prevention" Learn how knowledge graphs integrate model,…
⚡ Perspectives 13.3 is now faster than ever with web client rendering improvements. Available now, this release delivers faster, more efficient web performance through optimized rendering. Views in hidden tabs have reduced refreshes—resulting in up to 25% on average faster…

👋 Headed to INCOSE IS 2025 in Ottawa? Stop by Booth 816 and join our talks: 📅 July 28, 10:45AM | Room 214 "A Knowledge Graph Framework for Failure Analysis and Prevention" 📅 July 29, 4:30PM | Room 201 "Improve Systems Engineering Results with Integrated Visualization and…

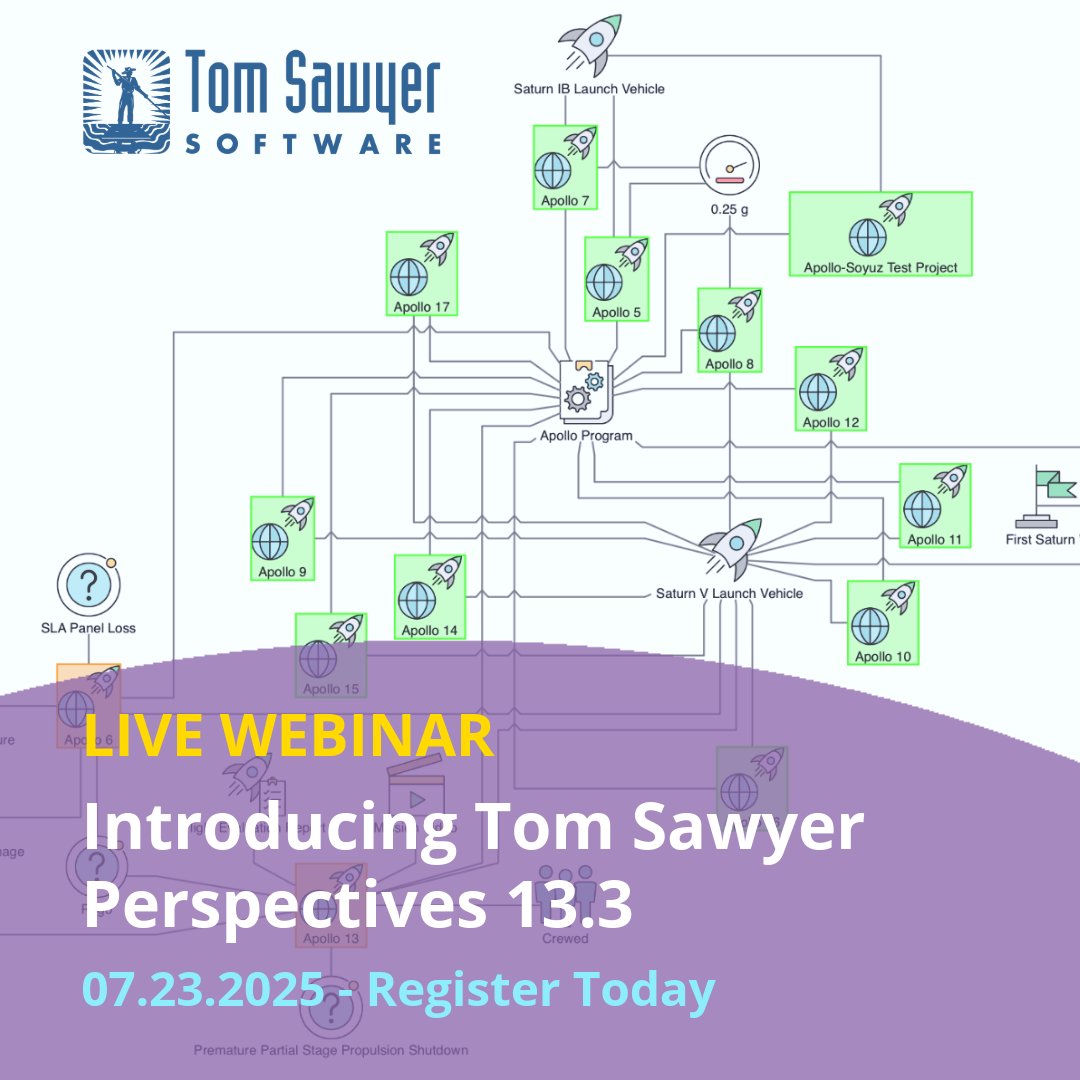
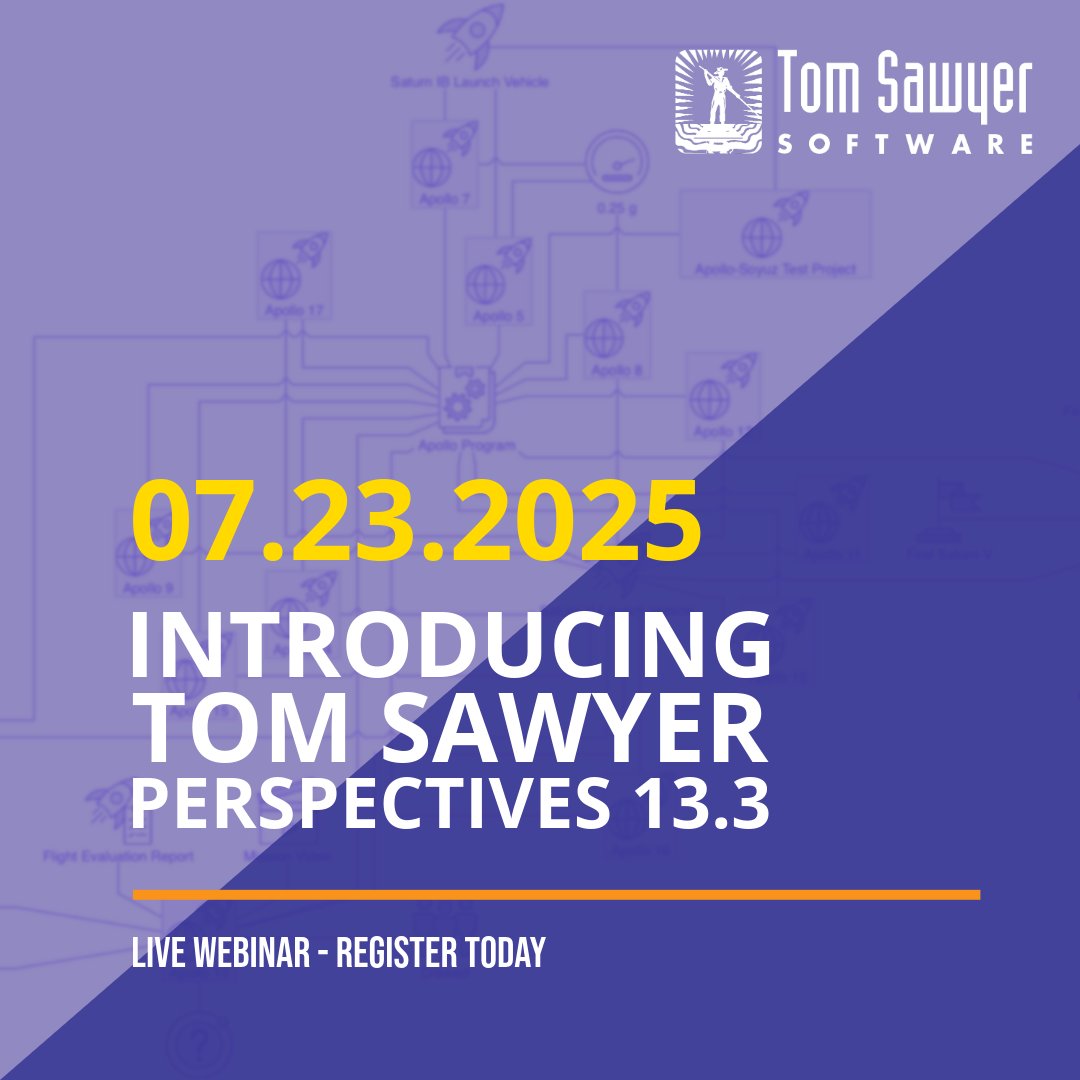
Free live webinar today. Don’t miss your chance to see Perspectives 13.3 in action with new #Kuzu graph database support, improved layouts, & more. Semih Salihoğlu, Ph.D. and Kuzu Inc. co-founder and CEO, will provide an overview of Kuzu graph database, the lightweight,…

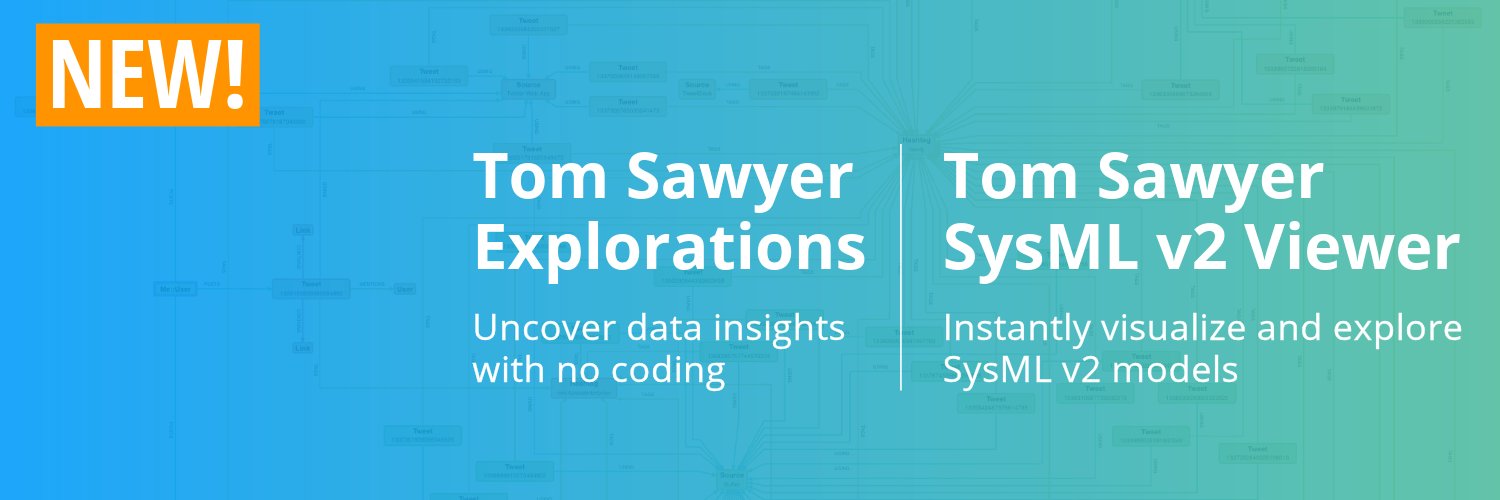
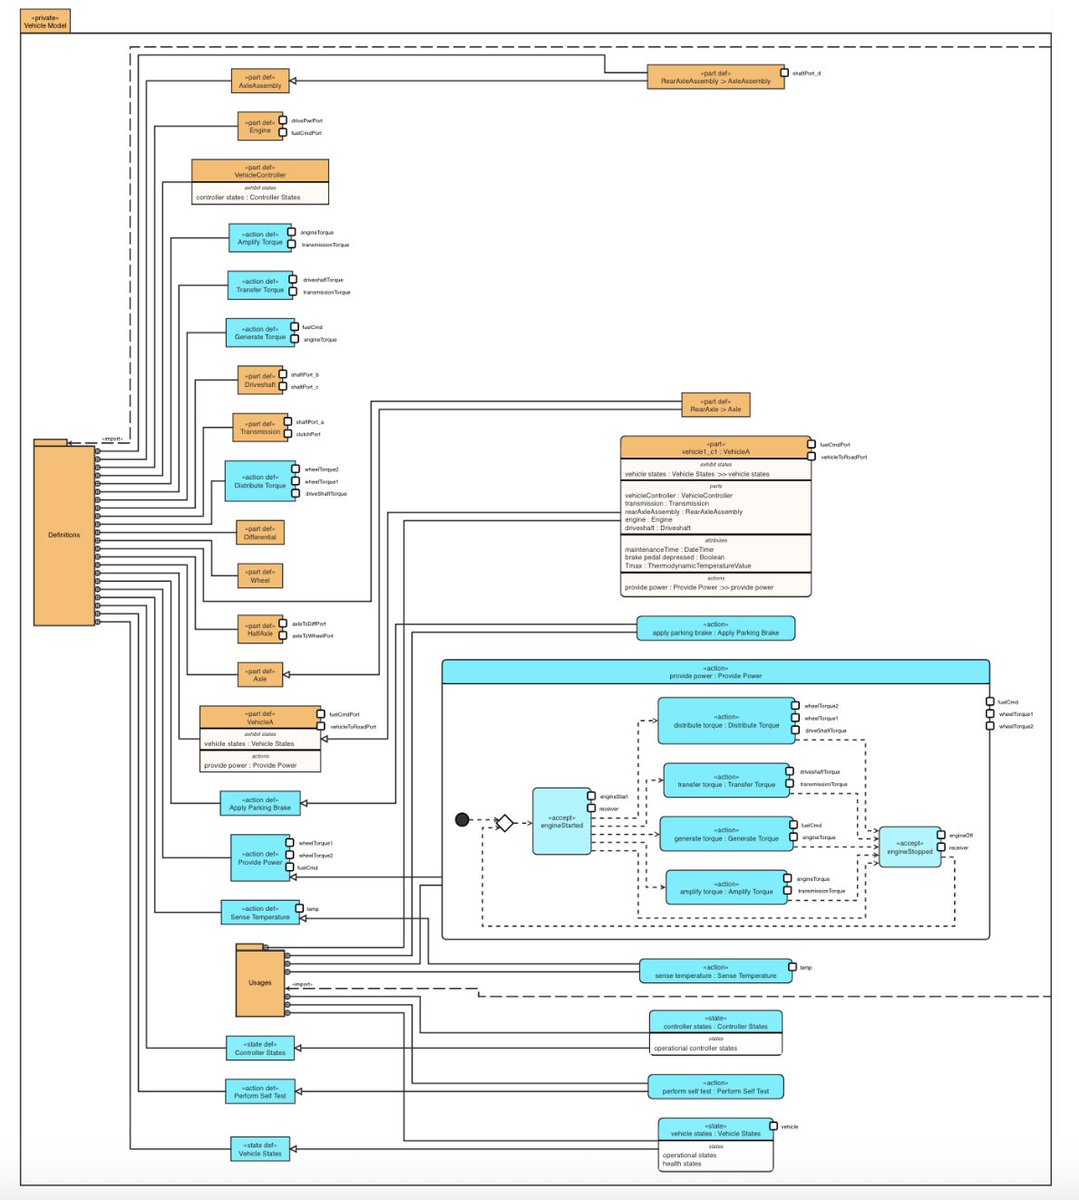
🚀 The final adoption of the new SysML v2 specification by OMG is an important milestone. We're proud to play a part in the new specification and support the standard with high-performance, interactive visualization tools that bring precision and clarity to even the most complex…
🧠 New Perspectives 13.3 release includes smarter circular layout. The circular layout algorithm now produces significantly clearer visualizations by optimizing cluster node ordering. Edge crossings are reduced up to 11% on average providing cleaner diagrams that help users…
Boost data insights. Join our webinar as we discuss new Perspectives 13.3 featuring Kuzu integration, smarter circular layout, performance improvements, & a new GraphRAG-ready demo. We will be joined by Kuzu Inc. co-founder and CEO Semih Salihoğlu Ph.D. who will provide an…
👉 In our most recent blog post, we discuss Golang Graph Visualization and compare it with UI frameworks like Flutter, Svelte, and WPF. Golang excels at fast, efficient graph computation and processing, providing a powerful backend foundation for scala... bit.ly/3IQFNvy
Unlock graph power. Discover Perspectives 13.3 with the new #Kuzu database connector enabling you to analyze and visualize graph data in Perspectives without the cost or complexity of traditional commercial graph database solutions. See a live demonstration of Perspectives and…
📣 New in Perspectives 13.3: Kuzu Graph Database Support! Perspectives now supports Kuzu, a lightweight, open-source graph database with Cypher support and optional commercial backing. This embeddable database runs locally on desktops and mobile devices—no server required. With…
🌉 Bridge gaps in your digital engineering process with Tom Sawyer Software. 📍 Join us at INCOSE IS 2025, Booth 816 📅 July 26–31 | Ottawa, Canada We help organizations unify models, simulations, digital twins, and field data into a single, coherent graph-based view so…

🧠 Available Now! Perspectives 13.3 expands graph intelligence capabilities with broader database support, faster web performance, cleaner layouts, and readiness for emerging GraphRAG workflows. This release helps organizations gain deeper insight into complex systems—faster and…
📣 New webinar alert! Join us as we explore the new Perspectives 13.3 release which helps organizations gain deeper insight into complex systems—faster and more flexibly and intelligently than ever. New capabilities include Kuzu graph DB support, smarter circular layout,…
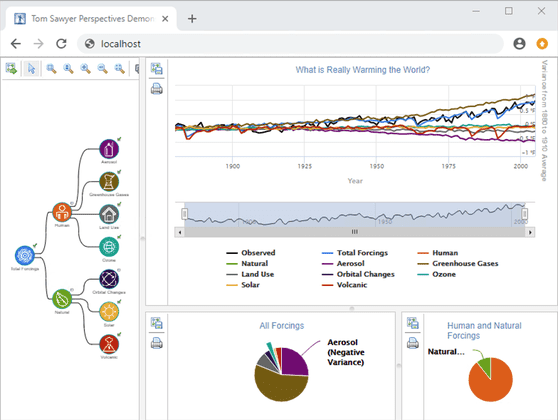
🧠 When is a Flourish line graph the right choice? Learn how Flourish helps visualize trends fast, and is great for quick, presentational line graphs. But what if your project needs real-time updates, system integration, or smart interactivity? That’s ... bit.ly/3Ghg1Qx
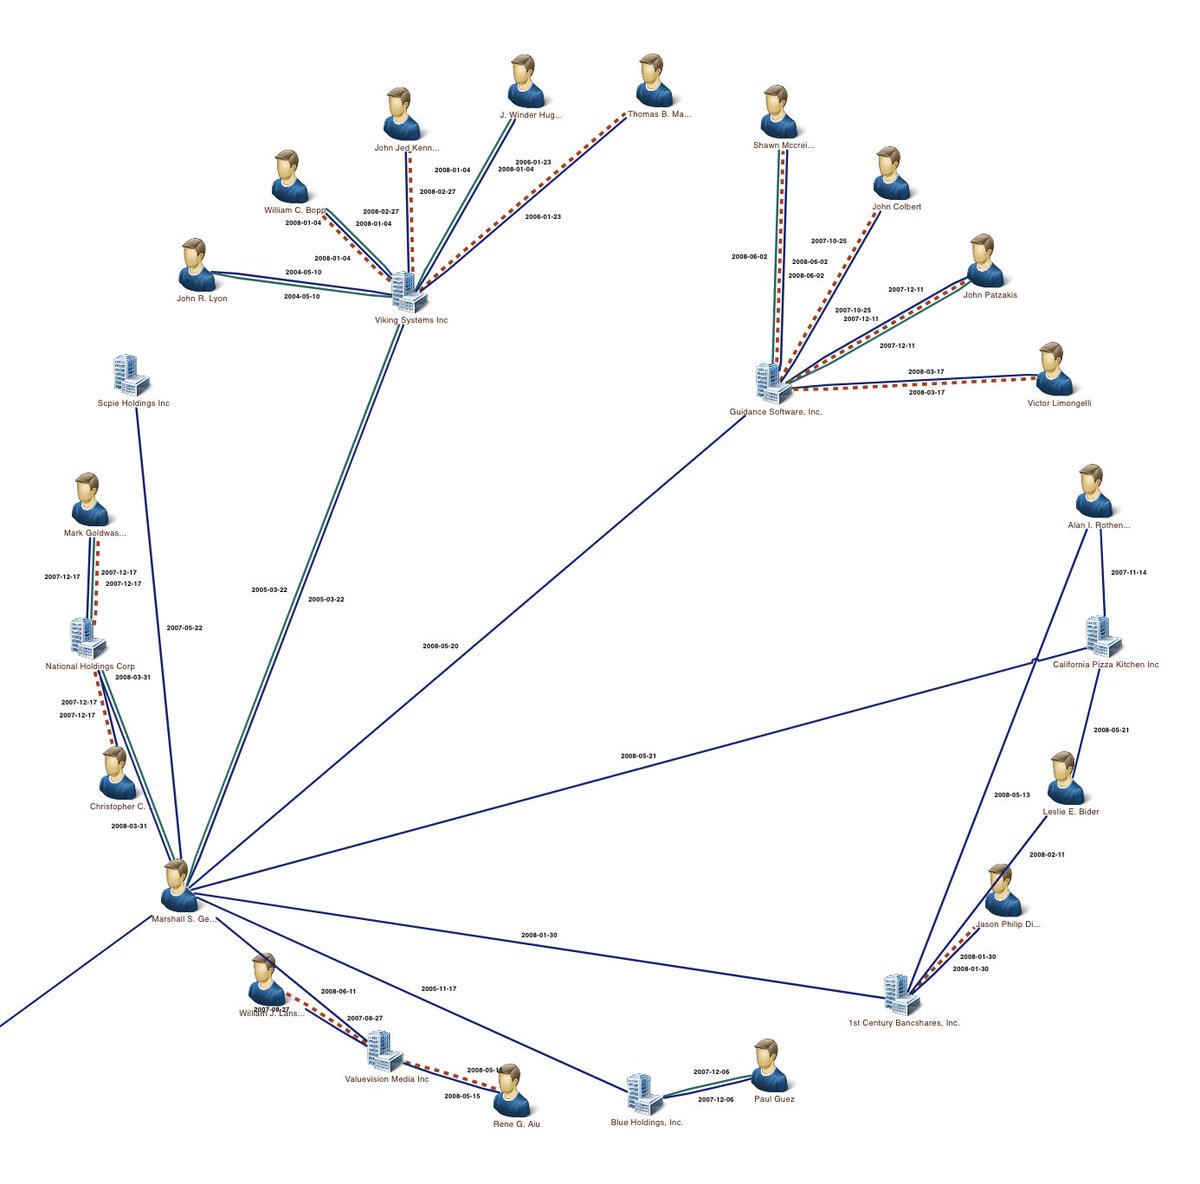
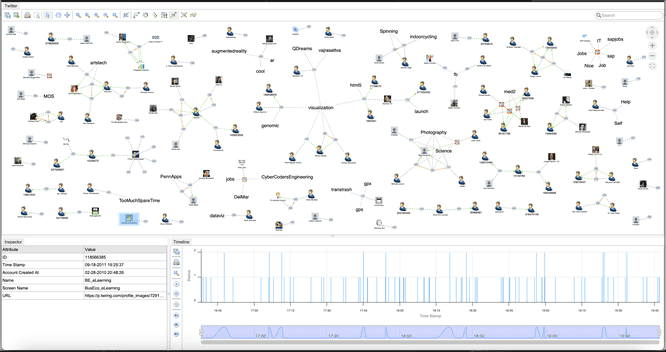
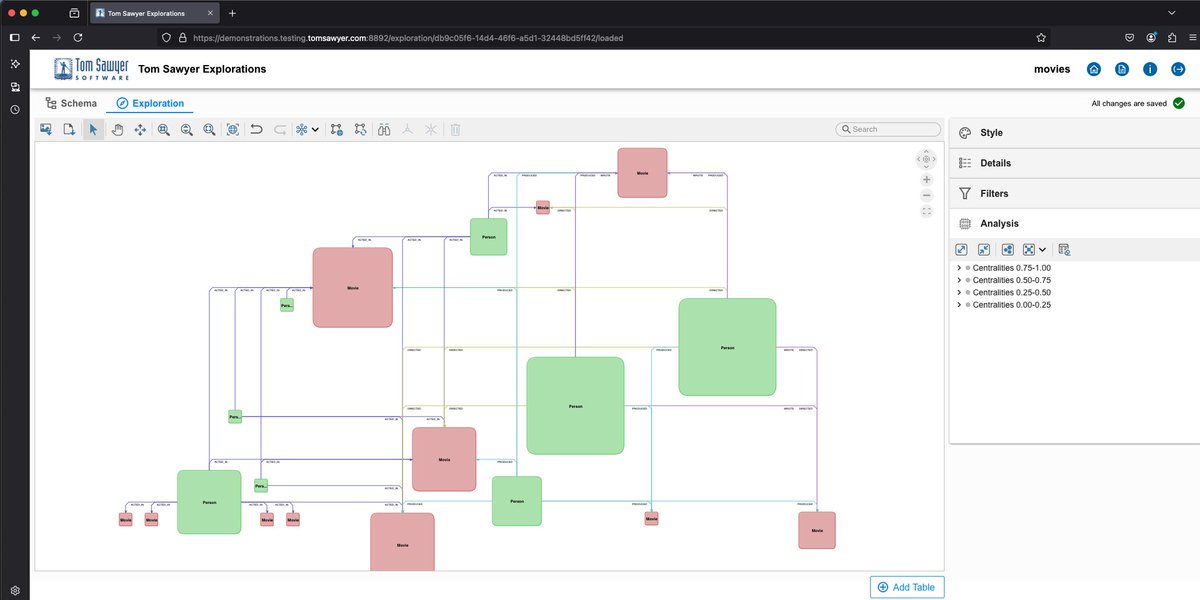
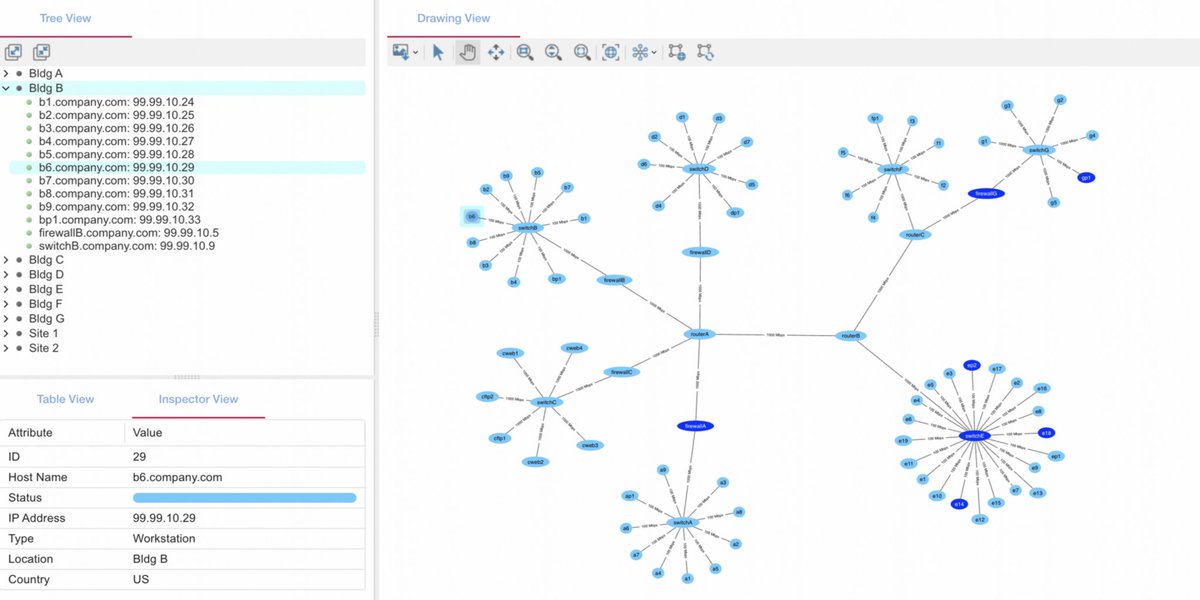
With Tom Sawyer Explorations you can connect, query, and run social network analysis in your data in under a minute! Learn more: bit.ly/44TAqo0 #graphdatabases #analysis #graphvisualization #graphtechnology
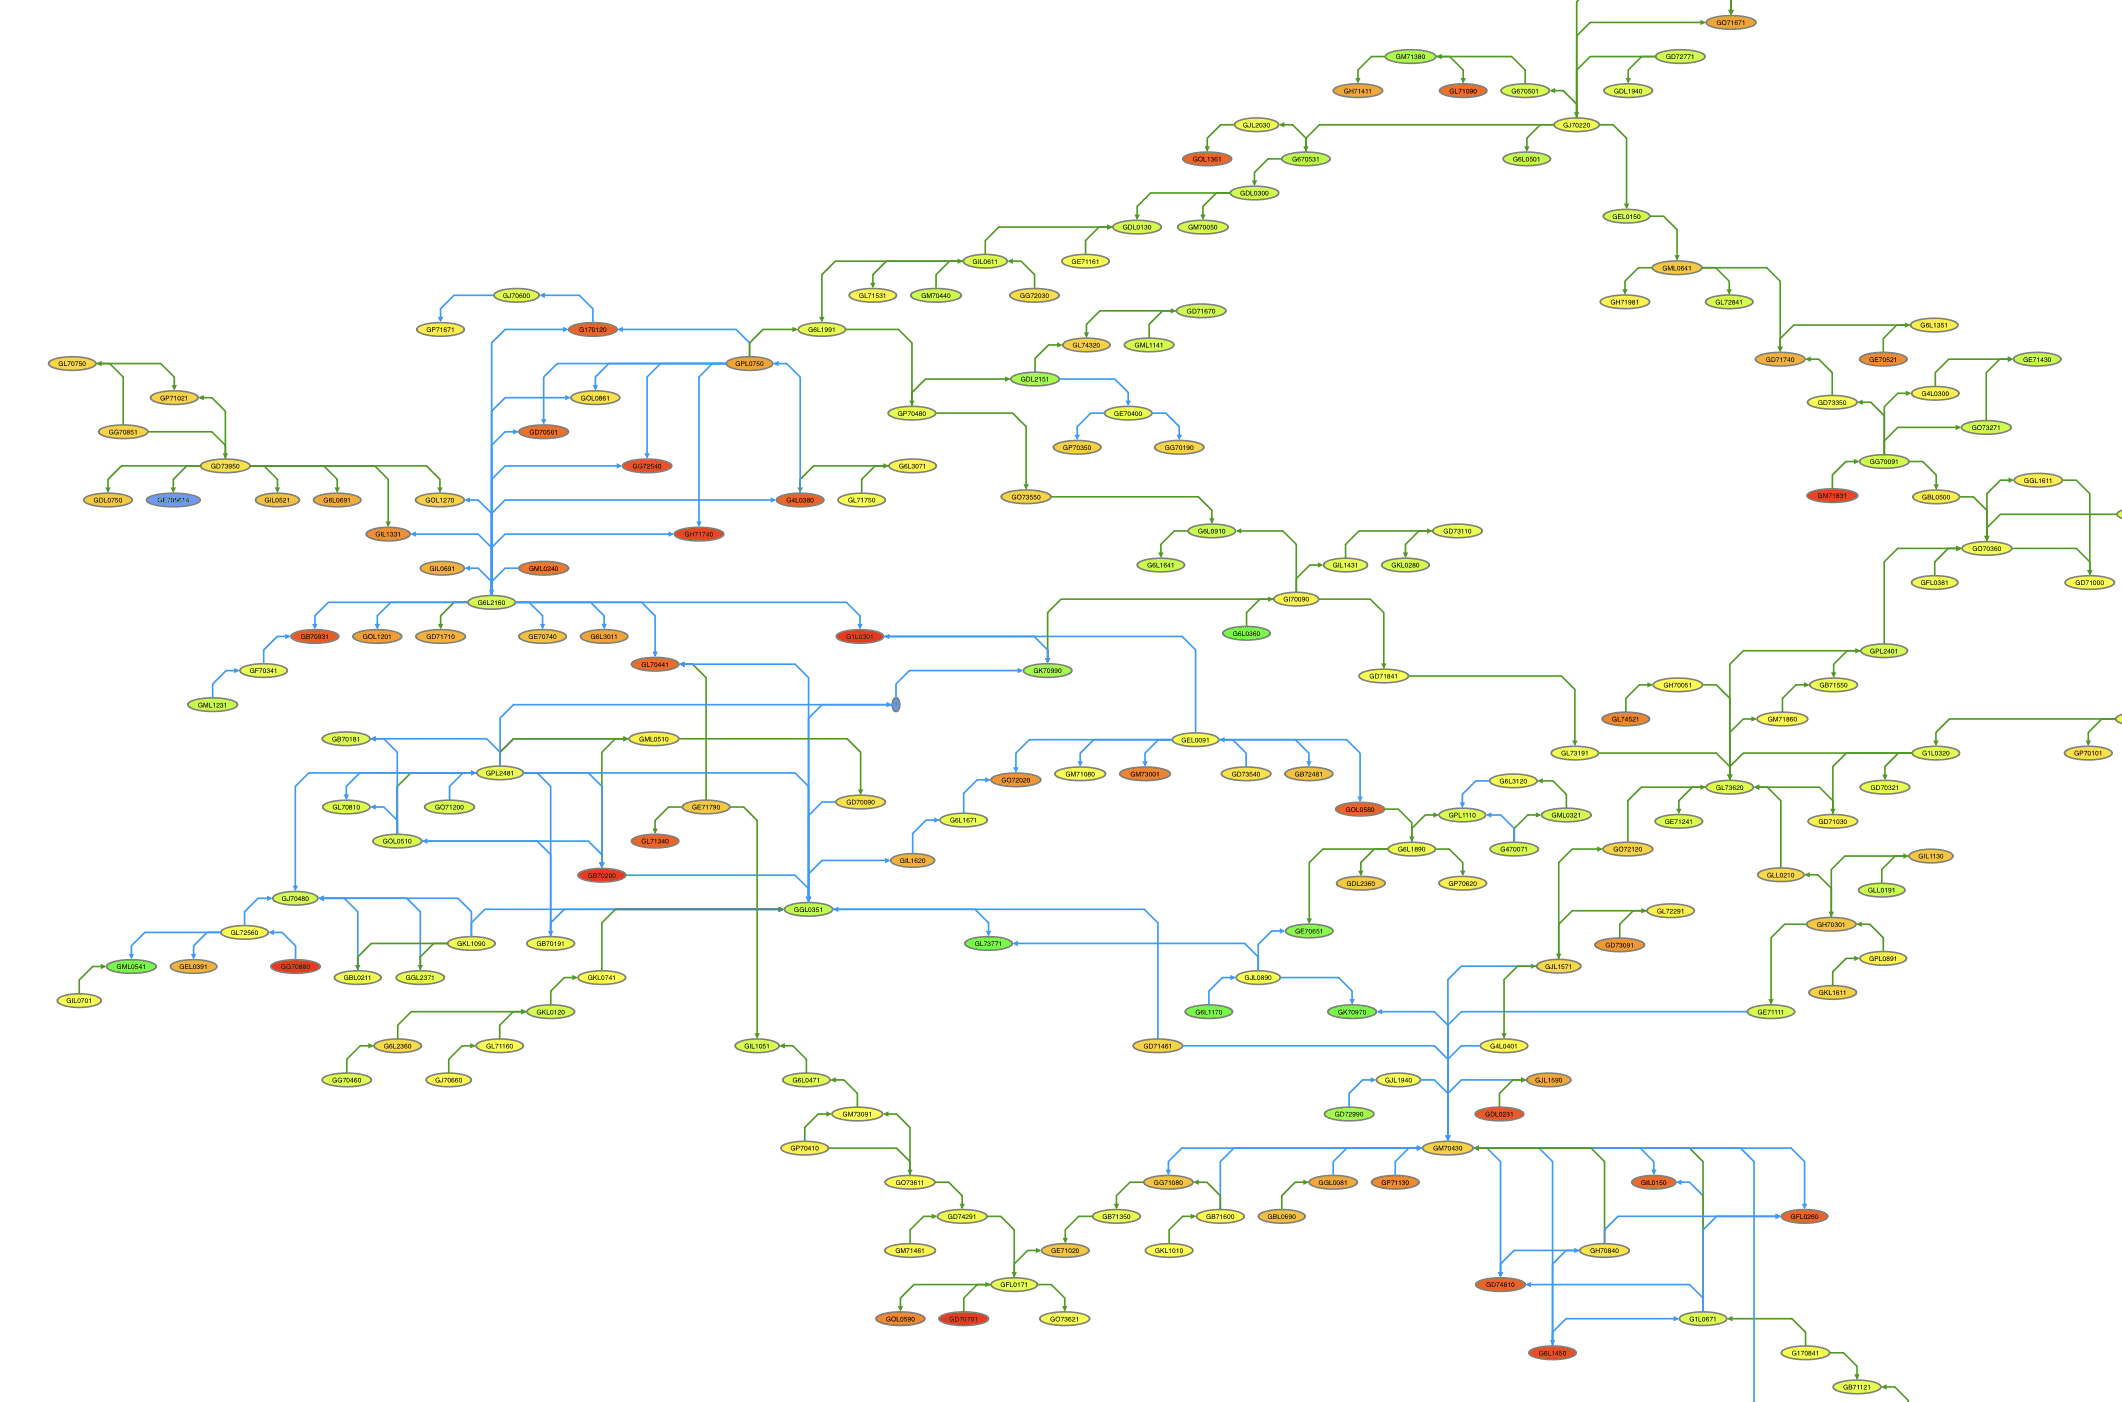
🔬 As biological datasets grow, so does the challenge of making sense of complex relationships. Discover how ontology graph visualization helps researchers reveal structure and meaning which is critical for discovery in life sciences—powered by Tom Saw... bit.ly/4lttBQ9
Curious about integrating advanced web components into your #Angular application? Check out how Tom Sawyer Perspectives makes it easy with this step-by-step guide! Build and innovate today: bit.ly/4kj2SUG #sql #graphdatabases #graphvisualization #graphtechnology
In our most recent blog post, we talk about Node.js and its data visualization capabilities. Discover how Node.js provides a modern, scalable approach for building responsive, interactive dashboards that are deeply integrated into backend logic. 🎯 #n... bit.ly/45YpYwH
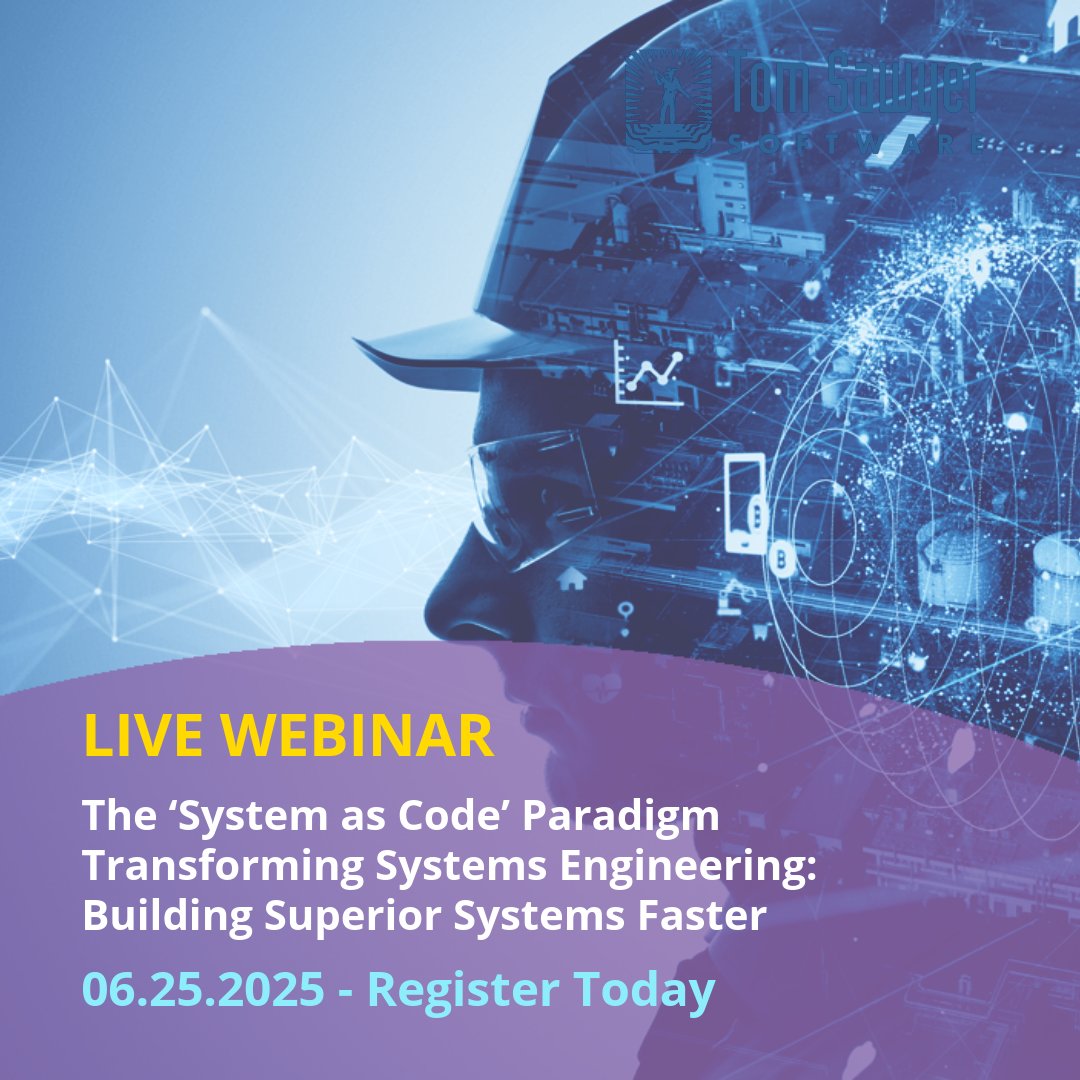
"System as Code" is redefining how we design cyber-physical systems—combining the power of modeling, automation, and software-like precision. Join us for a live webinar with Juozas Vaicenavicius, PhD, CEO of Sensmetry, and discover how early adopters are using SysIDE Pro + Tom…
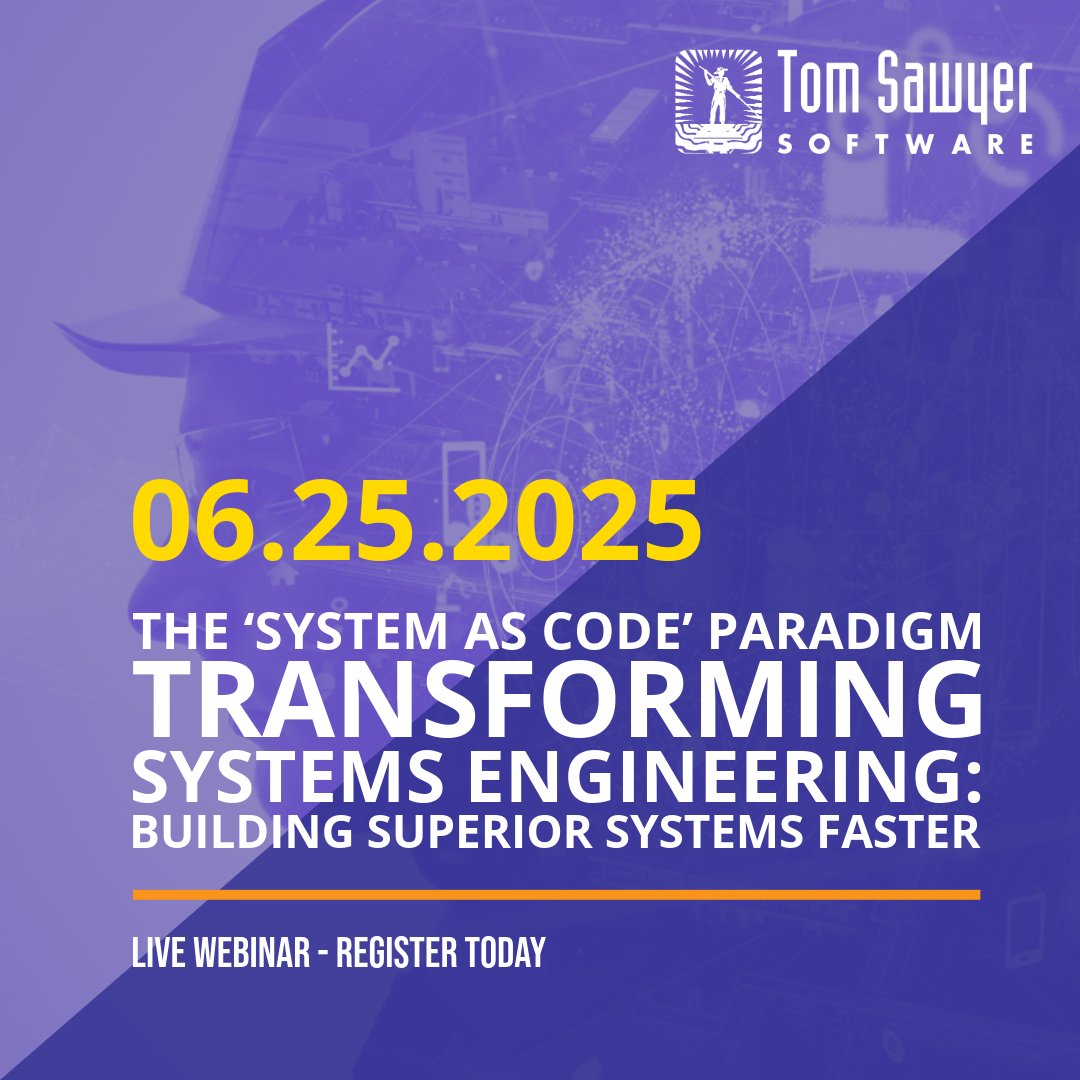
Systems Engineering is entering a new era. Manual processes are out and the “System as Code” paradigm is in—bringing automation, rigor, and speed through SysML v2 and next-gen tools like Sensmetry’s SysIDE Pro and Tom Sawyer SysML v2 Viewer. Join us for a live webinar with…