
Stata
@Stata
Powerful statistical software for data science. Analyze, visualize, & automate with Stata. • French: @Stata_fr | Spanish: @Stata_es
Last call to register! Join us in Nashville for the #Stata2025 Conference on 31 July–1 August. Connect with Stata developers, attend insightful sessions, and celebrate 40 years of Stata. Secure your spot: stata.com/us25 #Stata #StataConference #StatisticalSoftware

Meet the minds shaping the #Stata2025 Conference. The scientific committee plays a key role in the Stata Conference experience—reviewing abstracts, selecting speakers, and building a thoughtful, inclusive, and informative program. 🔗 stata.com/us25 #StataConference

We’re in Copenhagen for #AOM2025 🇩🇰 Stop by our booth to meet the team, learn about the latest Stata features, and grab some Stata swag. Join us on Sunday for our exhibit hall breakout presentation. Details: stata.com/news/conferenc… #Stata #StataCommunity @AOMConnect

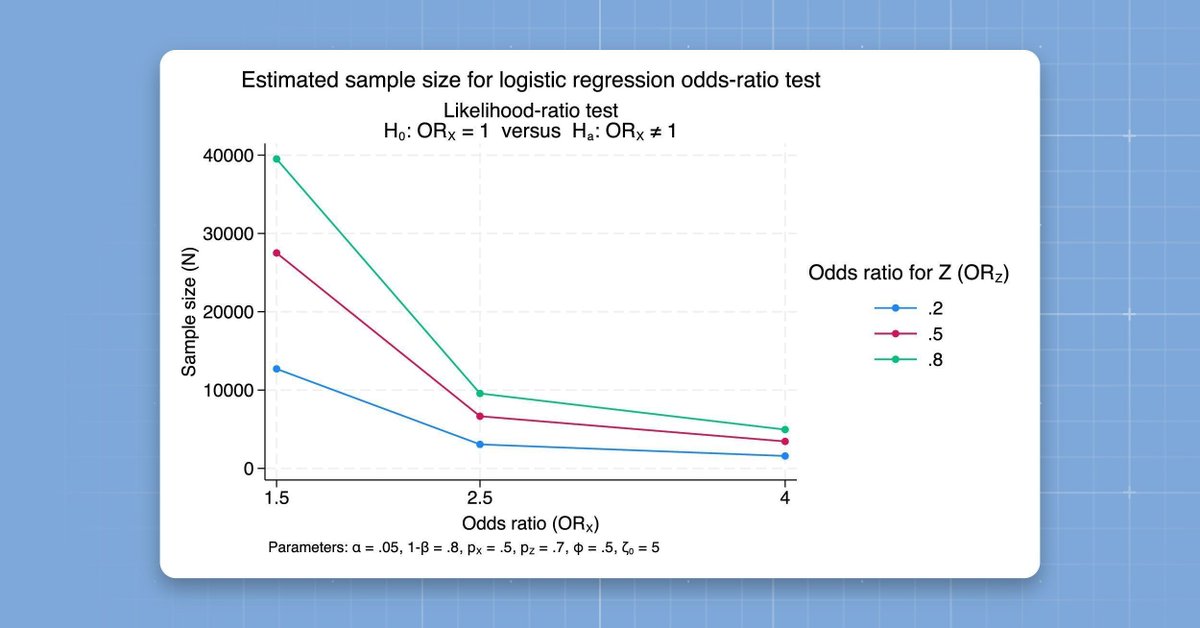
New in #StataNow: 𝗽𝗼𝘄𝗲𝗿 𝗹𝗼𝗴𝗶𝘀𝘁𝗶𝗰 Compute power, sample size, or effect size for logistic regression—fast. ▪️ One or two binary covariates ▪️ Binary + continuous covariates ▪️ Customizable tables and graphs Learn more: stata.com/stata-news/new… #Stata #StataTip
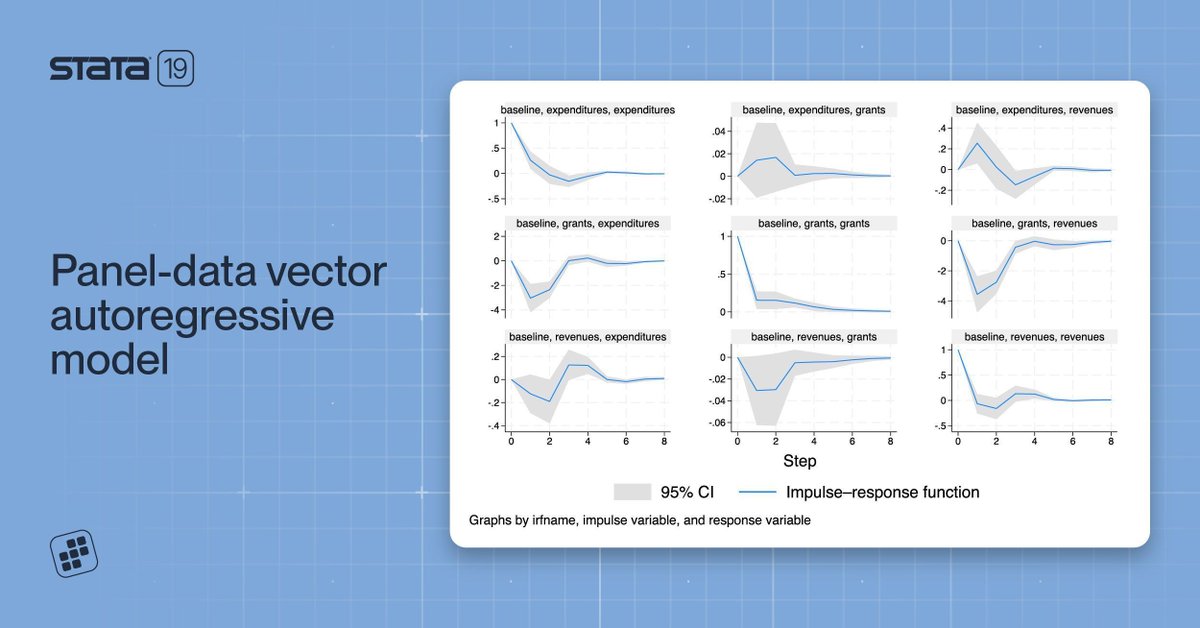
Want to estimate a vector autoregressive model with panel data? No problem. Try Stata 19's 𝘅𝘁𝘃𝗮𝗿 command, then perform Granger causality tests and estimate IRFs. Learn more: stata.com/new-in-stata/p… #Stata #Stata19 #StataCommunity
Thought you missed your chance to present at the 2025 Canadian Stata Conference? Good news, there’s still time. The submission deadline has been extended to 11 August. Submit your work or register today: stata.com/meeting/canada… #Stata #StataCanada25 #StataCommunity

One model. Many events. Full flexibility. 𝘀𝘁𝗺𝗴𝗶𝗻𝘁𝗰𝗼𝘅 fits interval-censored, multi-event data with ease. It supports TVCs, event-specific covariates, survivor plots, and more. Watch the full demo: youtube.com/watch?v=fu0bT9… #Stata #Stata19 #StataTip #StataDemo
Quick tips, powerful improvements, smarter workflows. Learn developer-approved tips and techniques. From graph templates to reproducible reporting—work more efficiently in Stata. Save your spot: stata.com/training/webin… #Stata #StataTraining #StataCommunity
How does on-field performance predict player value? See how Stata’s new H2O-powered ML tools use ensemble decision trees to model footballer market value. Full story: stata.com/stata-news/new… #Stata #StataNews #MachineLearning

Compare latent class models. Use 𝗹𝗰𝘀𝘁𝗮𝘁𝘀 to choose the right number of classes. Export publication-ready tables. Watch the full demo: youtube.com/watch?v=C-kCD-… #Stata #StataTip #StataDemo #StataCommunity
New to Stata? Or need a refresher? This course covers it all—data, stats, graphics, and reproducible reports. One course. All the essentials. Secure your spot: stata.com/training/publi… #Stata #StataTraining #StataCommunity
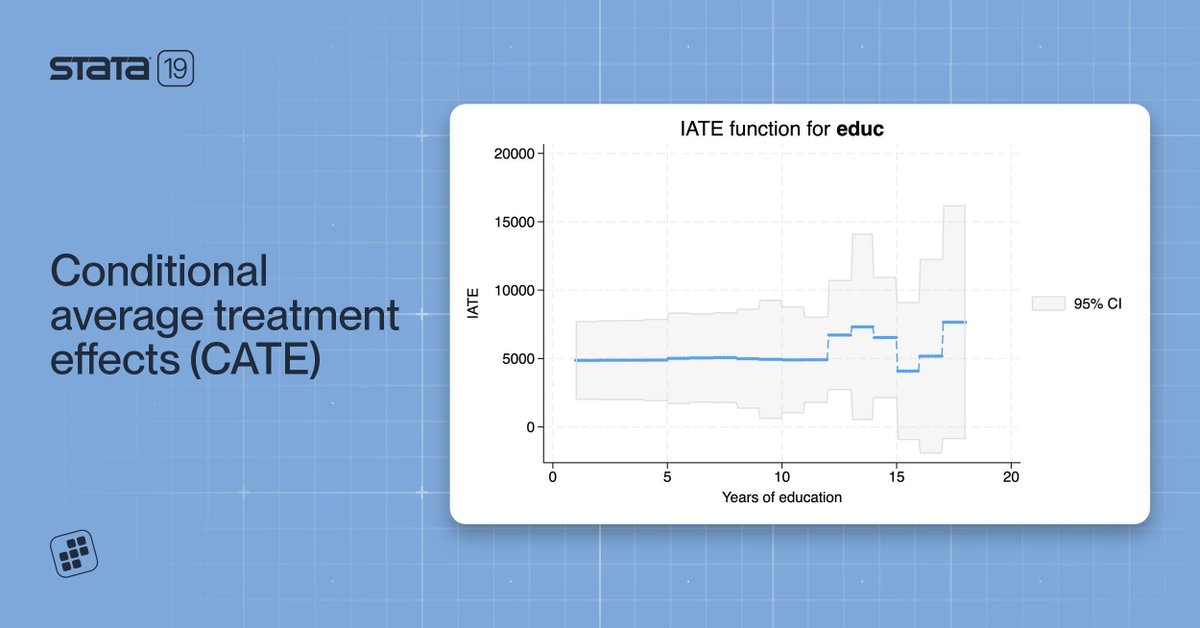
Not all treatments work the same for everyone. 𝗰𝗮𝘁𝗲 uncovers how effects vary across individuals and groups. From policy to personalization—CATE gives you the full picture. Learn more: stata.com/new-in-stata/c… #Stata #Stata19 #StataCommunity
Absorb high-dimensional fixed effects at scale. Big speed gains. Minimal output. 𝗮𝗿𝗲𝗴, 𝘅𝘁𝗿𝗲𝗴, 𝗳𝗲, 𝗶𝘃𝗿𝗲𝗴𝗿𝗲𝘀𝘀 𝟮𝘀𝗹𝘀—with 𝗮𝗯𝘀𝗼𝗿𝗯(). Watch the full demo: youtube.com/watch?v=odYb4O… #Stata #Stata19 #StataTip #StataDemo #StataCommunity
From sampling designs to poststratification. Analyze complex survey data with confidence. Live demo + hands-on. Course details: stata.com/training/publi… #Stata #StataTraining #StataCommunity

#Stata2025 session spotlight: Drawing maps in Stata using 𝗴𝗲𝗼𝗽𝗹𝗼𝘁 Ben Jann, University of Bern Learn how to create customizable, layered maps from shapefiles and datasets in Stata. Full abstract + program details: stata.com/meeting/us25/ #Stata #StataConference