david reutter
@ReutterDavid
retiredlushinahammock
move predicated on the $flows flatlining, and the divergence, we could pullback to 627 here (note the lower hi's) and last hit was friday, in this newsdriven market a slight selloff might be in the cards.

$flow and price correlate pretty closely. when $flow mean reverts so does price. on the bubble right now, give it a few hours and wait for a break higher? longer term this feels vulnerable.
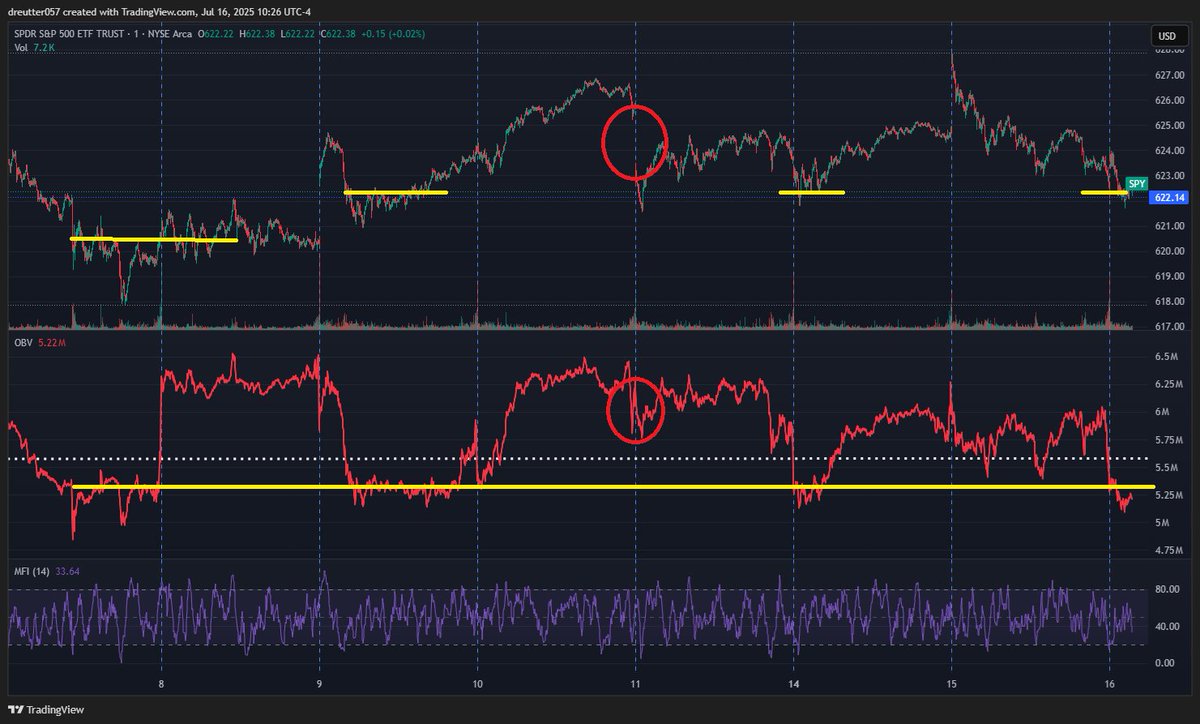
A lost week ends. OBV remained above its benchmark mostly, prices did not. Net Net. Tops like this are like bankruptcy, slow at first then sudden. Tariffs dont matter, interest rates don't matter. raise cash to buy Sept 1st. $ is so good here you buy the dips even on down days.

seems we should at least test the trend line, with $flows being positive. if you flip the chart you can see that 110 would be a nice place to buy and it feels coiled for a breakout right here


$flows have broken support, this is not one trend line but a series of lower highs and lower lows. A drop to former trend line level is 560, the actual trend line is lower. first price line is blue 576, the action there defines the move. Cut thru no resistance we go lower

When the $flows OBV are above the dot yellow line you can sell the SPY, when they're below you can buy. When that relationship breaks, you're on your own

Tuff call, buy the calls for a move back to 599, while the $flows (OBV) are testing the lows. look for the break in $flows w/o a new low in price to buy puts.


KBE: the rising wedge or pennant is 30 points with a break at say 40 = 10. On a day when the T Sec says "WE WILL NOT DEFAULT". and SILVER RIPS we approach the 2011 moment, OP TWIST, only then all the damage to the banks has been done. EFFR was zero and bond yields too high.

this is scary, a 50 pts diamond on the weekly, with a break at say 45, you owe them to hold this. KBE is little different.

The myth of the Retail Rally: MFI hasn't been overbought since Dec. Selloffs A,B,C each started with a different money flow. The rallies however begin simultaneously. Best guess is that ODTE traders w/o expensive bloomberg terminals w presidential news access are on the sidelines

2nd test of trend off the 23 bottom, and 3rd test 549 days later is Oct 8 26. The point here would be that's lower than the 25 high and nearly two years of negative returns. this scenario the 22 bear market in replay. Its all about lost time.

New tranche lower opens in OBV $ flows, we might hover here for a day or two. The spread btwn white/blue and blue yellow is large. the daily chart downtrend was crossed up by the relief rally, hot money rally ends? the porridge gets cold, bears are not happy. growl


New kid in town, $flow level at 4.58M OBV, we might get above it for a while but it looks solid.

money flow getting interesting. lurking beneath the 1 min benchmark

the catalyst here is the fast drop in NFCI. This feels 2010ish, with stealth QE, retro-tariff fears (retro GFC) and seasonal (May) if the Fed were to drop rates here, that might not be bullish. if the chart mirrors out we have new lows ahead.
