Placer.ai
@Placer_ai
📍The most advanced #locationanalytics platform for anyone with a stake in the physical world. #retwit #foottraffic Learn more @ http://placer.ai
.@benandjerrys absolutely crushed National Ice Cream Day this past Sunday with a whopping 58.9% more visits than their average Sunday so far this year. @DairyQueen (33.1%) and @BaskinRobbins (14.5%) also saw a sweet surge!🍦
Thank you to our valued customers for sharing your experiences and driving our innovation forward!


.@luckincoffeeus's new Broadway Ave spot in NYC is a smash hit! ☕ Open for just 3 weeks (June 30 - July 20, 2025), it's already pulling in 168.1% more visits per square foot than neighboring coffee chains within a 5 mile radius.
A new @Hamptons hotspot dominated 4th of July week! While Bridgehampton typically draws the most Manhattanites year-to-date (23.5% of visitors), East Hampton saw a surge and took the top spot (30.1%) this year. 🏖️
.@dunkindonuts saw overall visits and average visits per venue up 1.7% and 0.3% YoY, respectively, in Q2 2025.
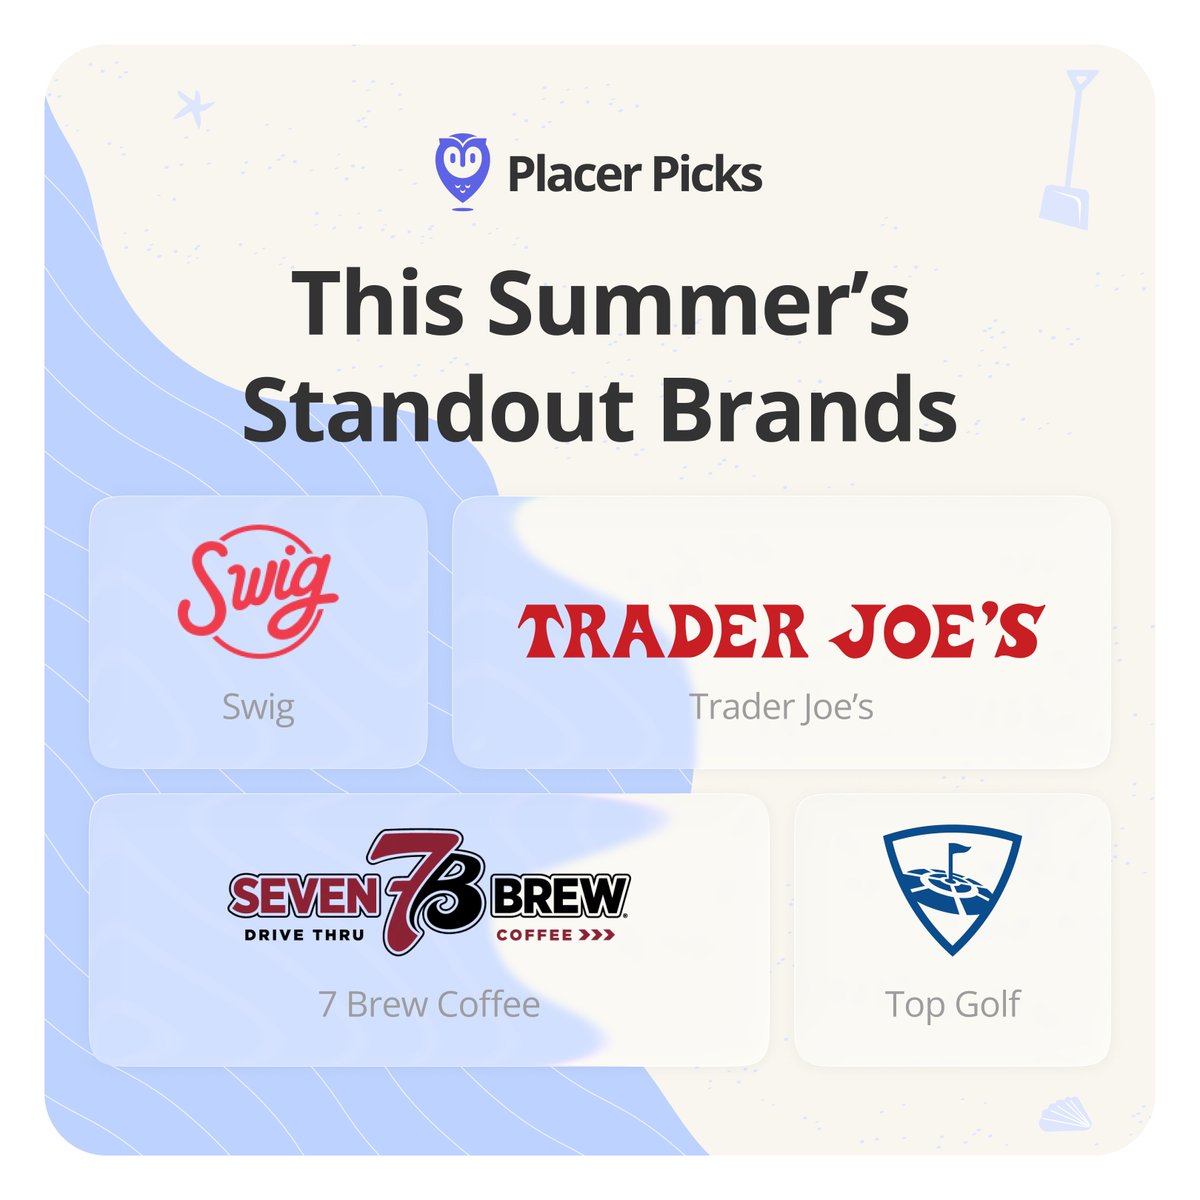
For this month's #PlacerPicks, we're diving into the data to spotlight 4 companies making significant waves this summer. 🔹 @swigdrinks: Known for their "dirty sodas" and TikTok fame, Swig is seeing visits surge as they continue their impressive expansion, up 44.8% YoY in June.…
In Q2 2025, visits to @DutchBros grew 13.8% YoY alongside a 0.8% increase in average visits per venue.
The world has changed in the past 5 years – and so have consumers. Our latest white paper reveals exactly how those habits have evolved across retail, dining, entertainment, and even the office. placer.pulse.ly/rogxawcsbu
Office comeback? The numbers are still saying "maybe later." In H1 2025, visits to office buildings nationwide were still 33.3% below 2019 levels, despite RTO efforts.
Average visits per location at @Allbirds were elevated by 13.2% YoY in June 2025.
.@ChipotleTweets's visits grew 2.4% year-over-year (YoY), and visits & visits per location outperformed the wider fast-casual segment in nearly all quarters from 2024 onward. $CMG
.@wingstop's customer loyalty is flying high with 16.8% to 18.1% repeat monthly visitors in H1 2025. 🍗
Foot traffic experts by day, future tellers by night! Check out this article we wrote last month about the @coldplay effect. 😉 placer.pulse.ly/iurfiznrfy

Nathan’s Famous Hot Dog Eating Contest at @ConeyIslandFun on July 4th wasn’t just a spectacle, it was a major economic driver! The event brought 709% more visitors to the nearby area than the year-to-date daily average. 🌭 @originalnathans
The @NBA Playoffs brought more than just game-time action! 🏀 The @nyknicks' opener caused a massive foot traffic surge around @TheGarden (thanks, block party!). Meanwhile, @okcthunder games saw a shift to higher household incomes among attendees. Major sports events truly…
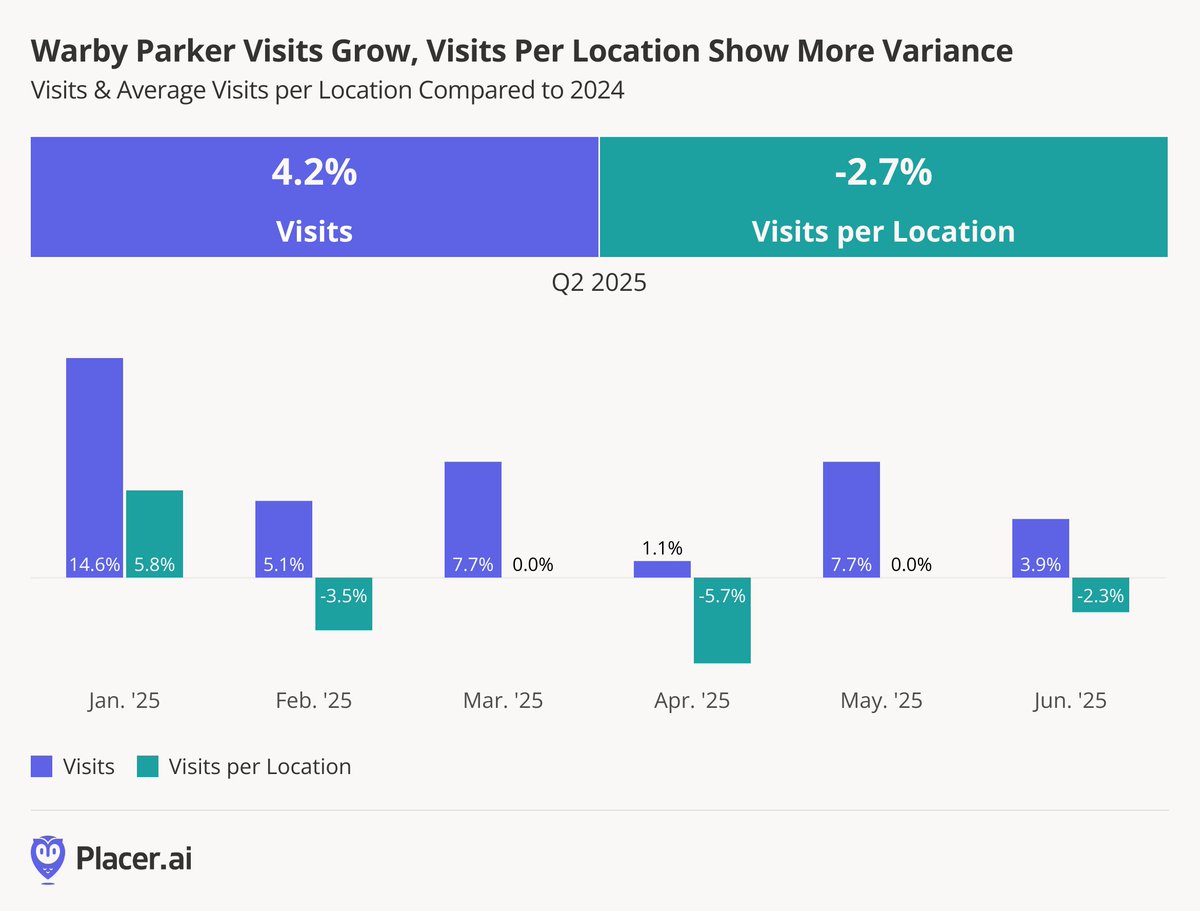
.@WarbyParker's expansion is driving overall visit increases in 2025! 👓 While average visits per location declined 2.7% YoY in Q2, this likely reflects their strategic focus on market penetration and stores as omnichannel touchpoints, not just traffic.🚦
.@Beyonce's Cowboy Carter Tour brought more than just music to NYC! 🎤 When the star singer played at @MetLifeStadium, the American Dream Mall which is nearby, saw a 35.1% jump in its average daily visitors compared to its usual daily numbers for the year.
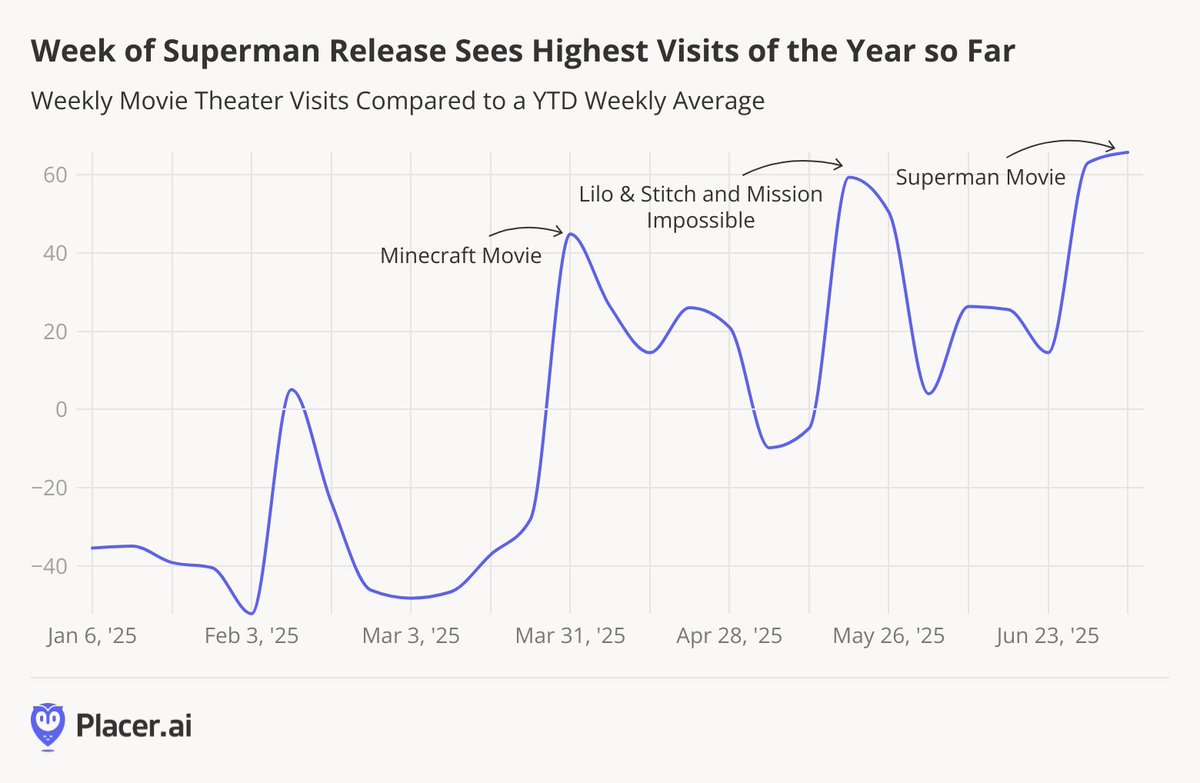
The week of the @Superman movie release saw the highest movie theater visits of the year so far, surging 65.7% above the year-to-date weekly average. 🎥
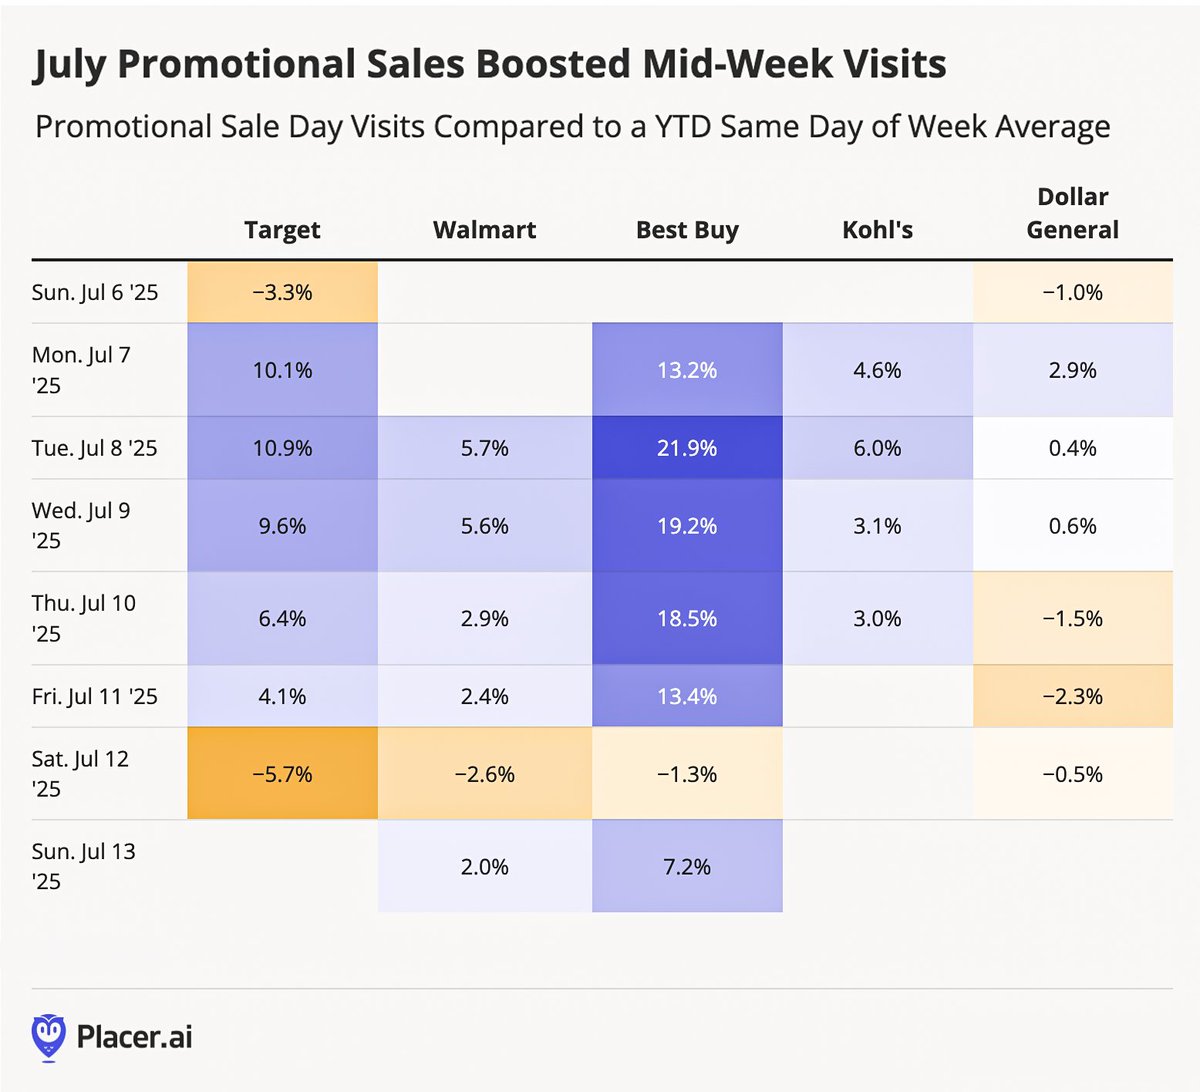
New data on July retail campaigns reveals a surge in weekday traffic for major retailers. This pattern suggests consumers leveraged sales for big-ticket purchases at discounts but didn't use the opportunity to stock up on lower-priced items. Leading the charge was @BestBuy,…
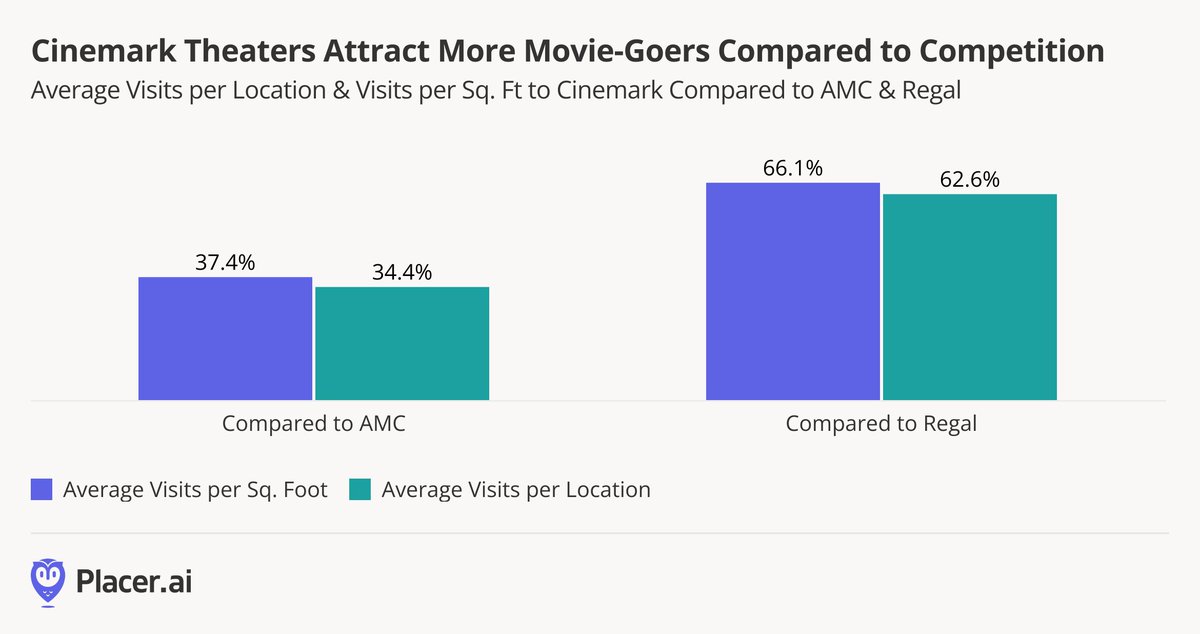
.@Cinemark is filling seats! 🎬 Their higher visit numbers stem from fuller theaters, not just more locations or larger venues, as they average more visits both per location and per square foot.