Bas (How to Power BI)
@HowToPowerBI
Power BI reports that make a difference 🚀 training 600 k + followers in Power BI across social platforms 👉🏼http://datatraining.io http://datatraining.io
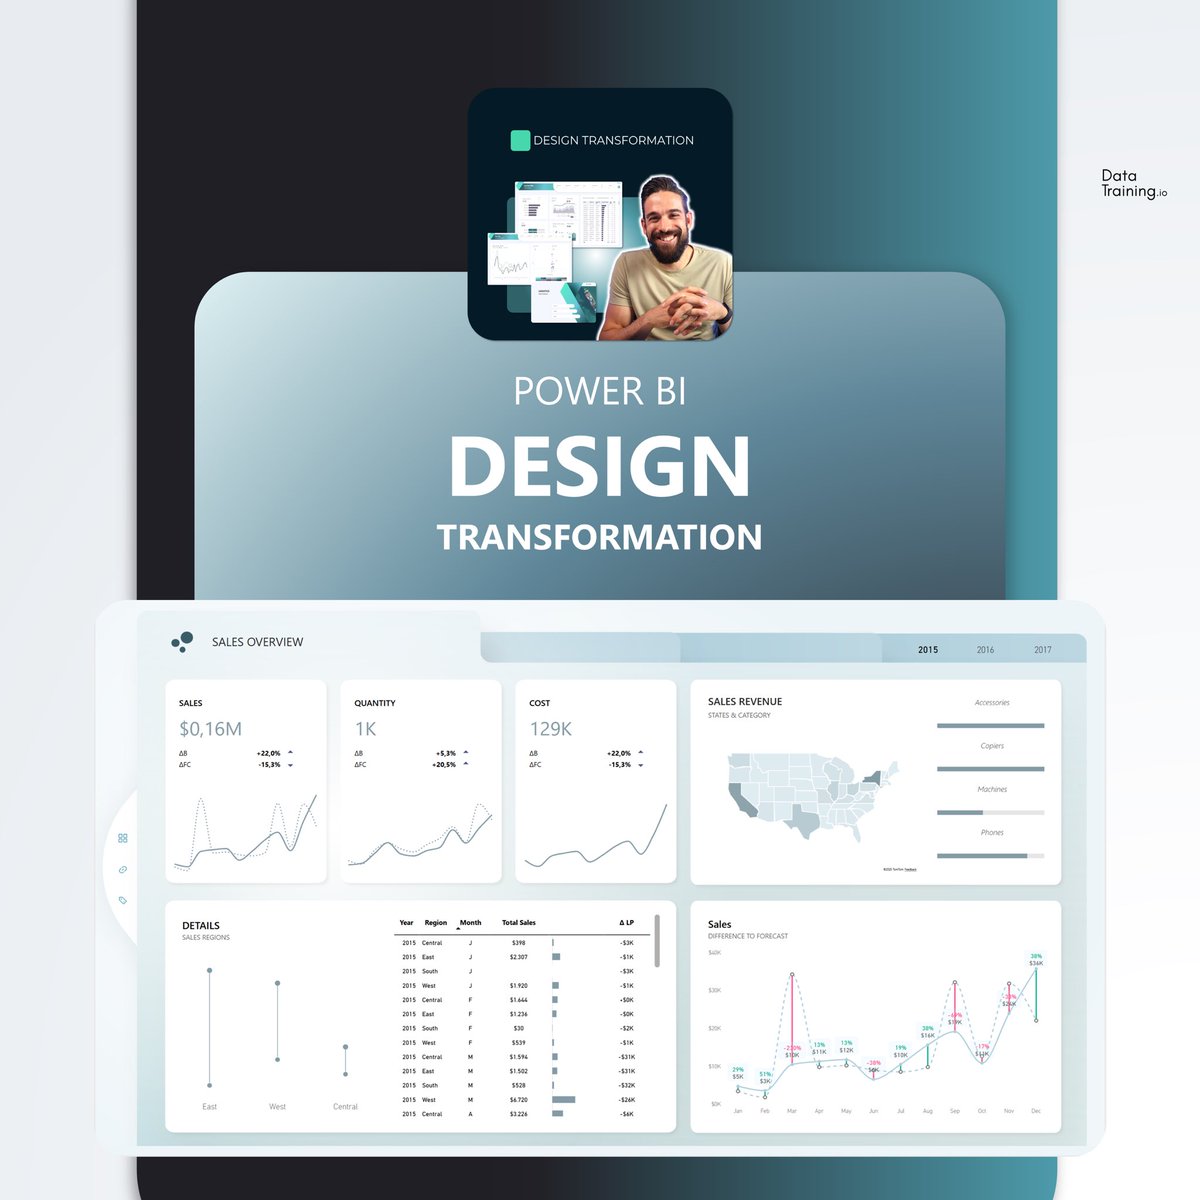
Reports could be better? Users not satisfied? Learn how to design reports that work with Bas Dohmen (How to Power BI) What is included? + Live Sessions (28h = 8x 3.5h) with Bas + 4 Implementation Assignments and Guidance + 10h of Power BI Design Video Content (2 years) + 24h+…
Not a fan of pie charts? See this! New video on YouTube 🚀 #powerbi #visual #analytics #visualization

The one button you „skipped for now“ because „who would click it anyways“. They did… 😅🤣 #powerbi #report #design #skills #dashboard
Do you have a report home/navigation page? #powerbi #dashboard #report
You told them this is just a draft report and should not be used just yet… next thing you know it is the core of quarterly management presentation. 😅 #analytics #data #people #ux #design #draft
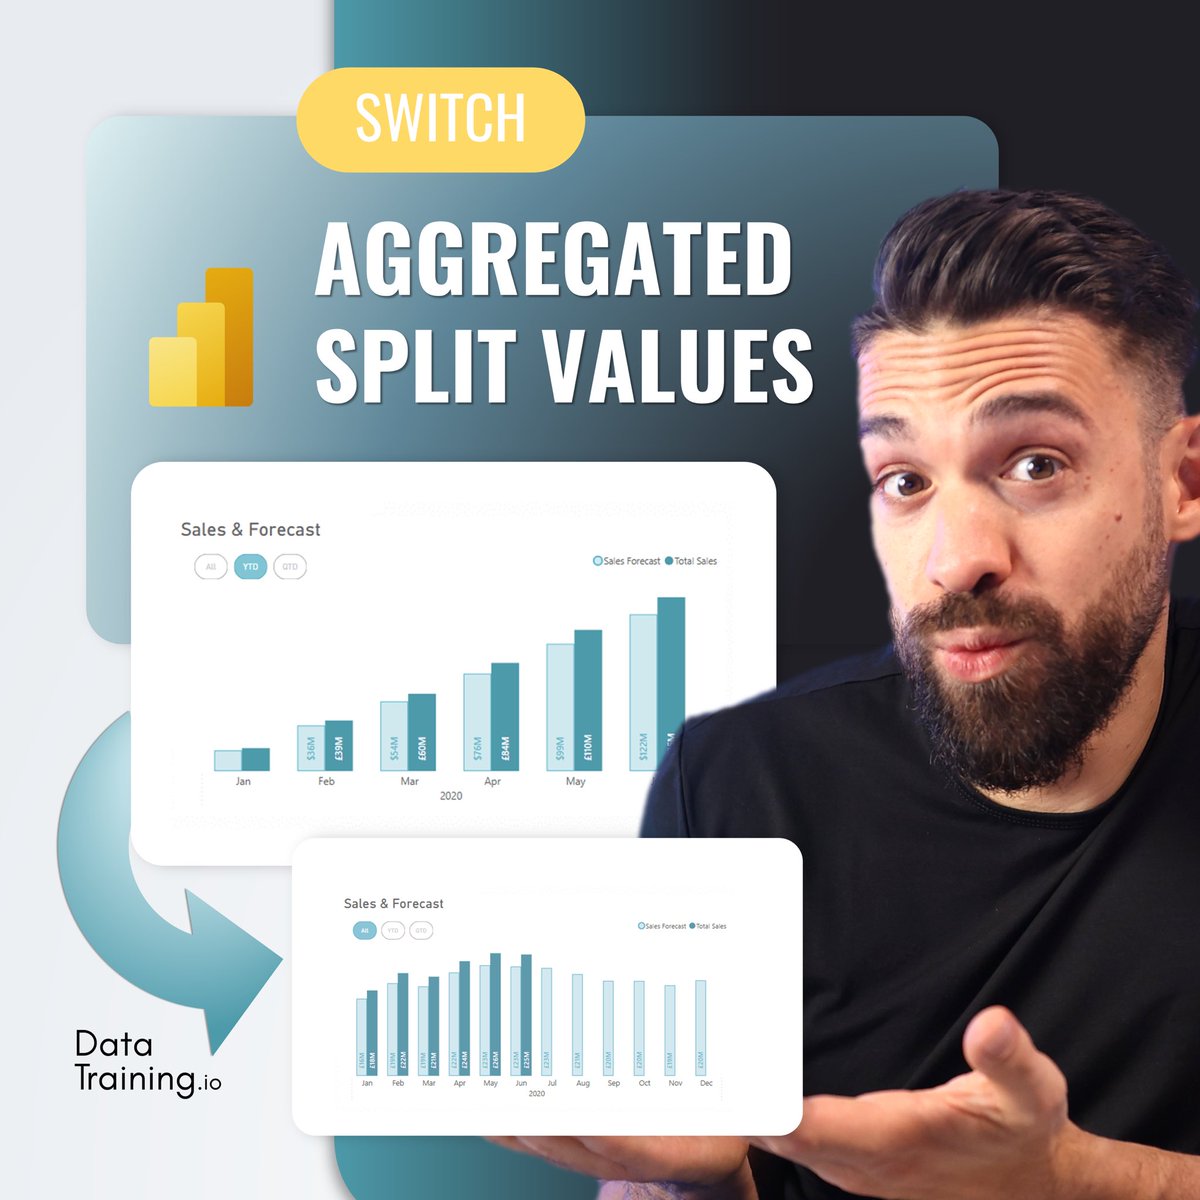
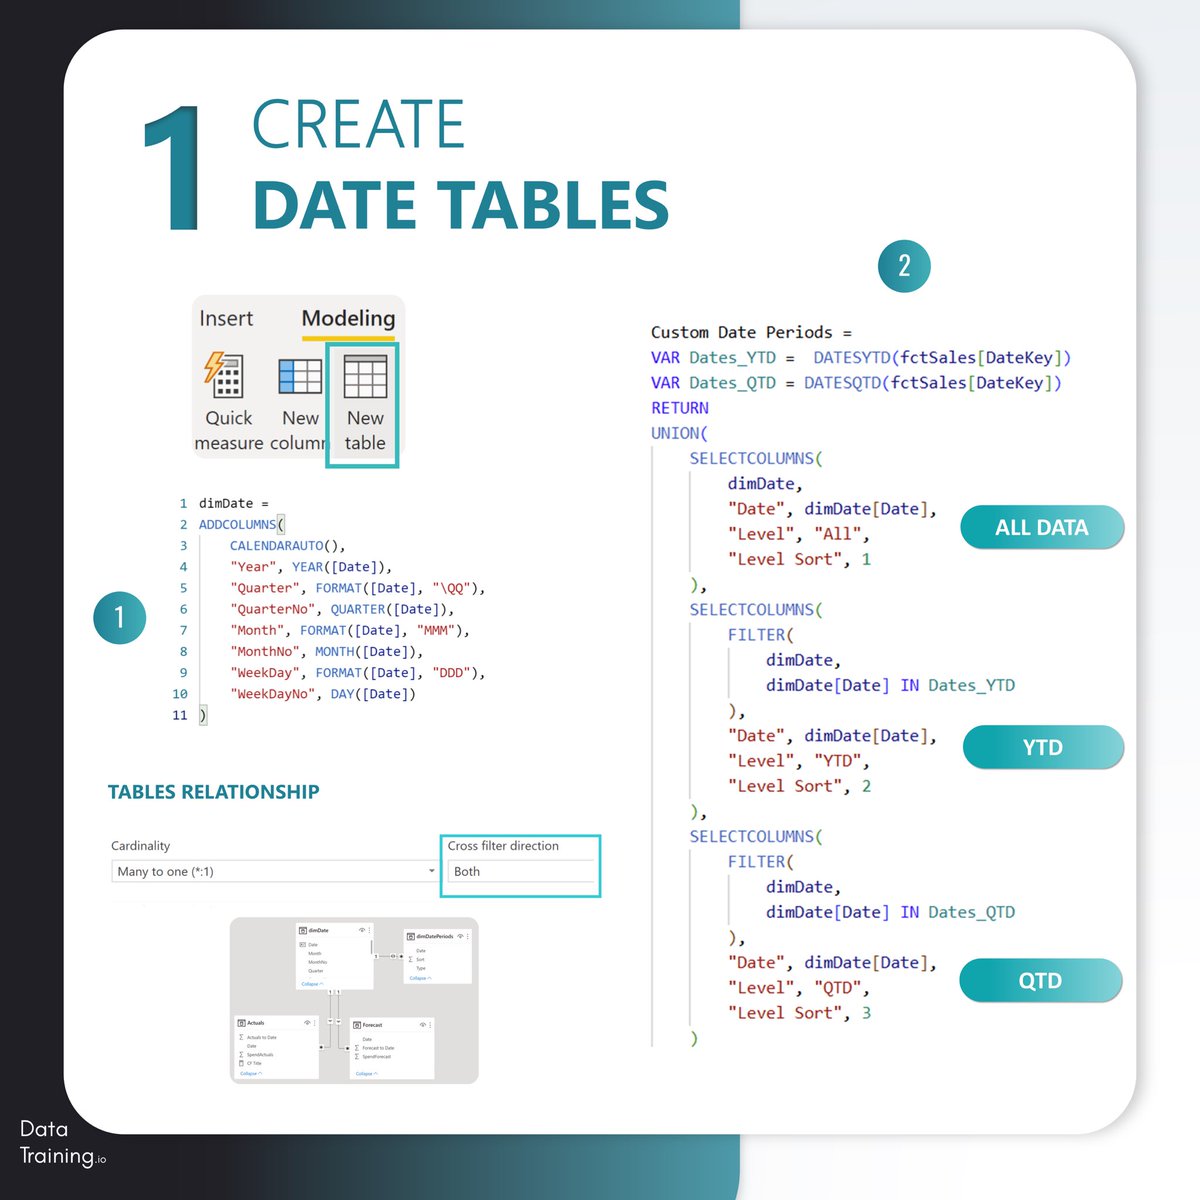
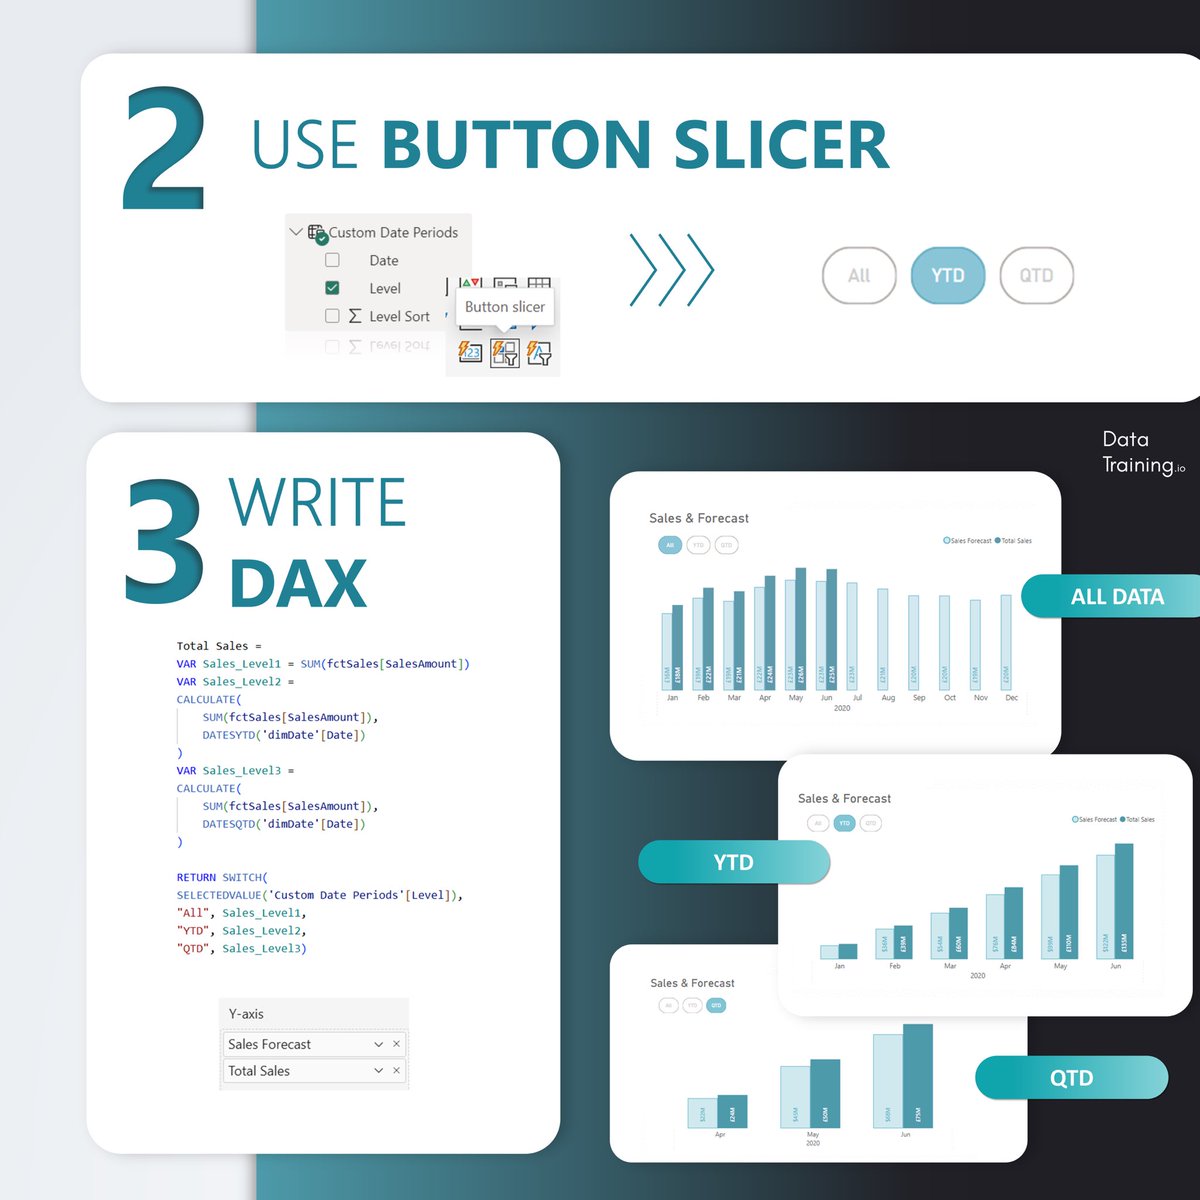
The SWITCH every budget analysis needs! Toggle between aggregated YTD, QTD and monthly split values 🚀✌️ 80% of UX Report Design is in good visuals. Learn my approach to building meaningful reports 4th September 🙌 #powerbi #report #design #dashboard #transformation #uxui #ux…
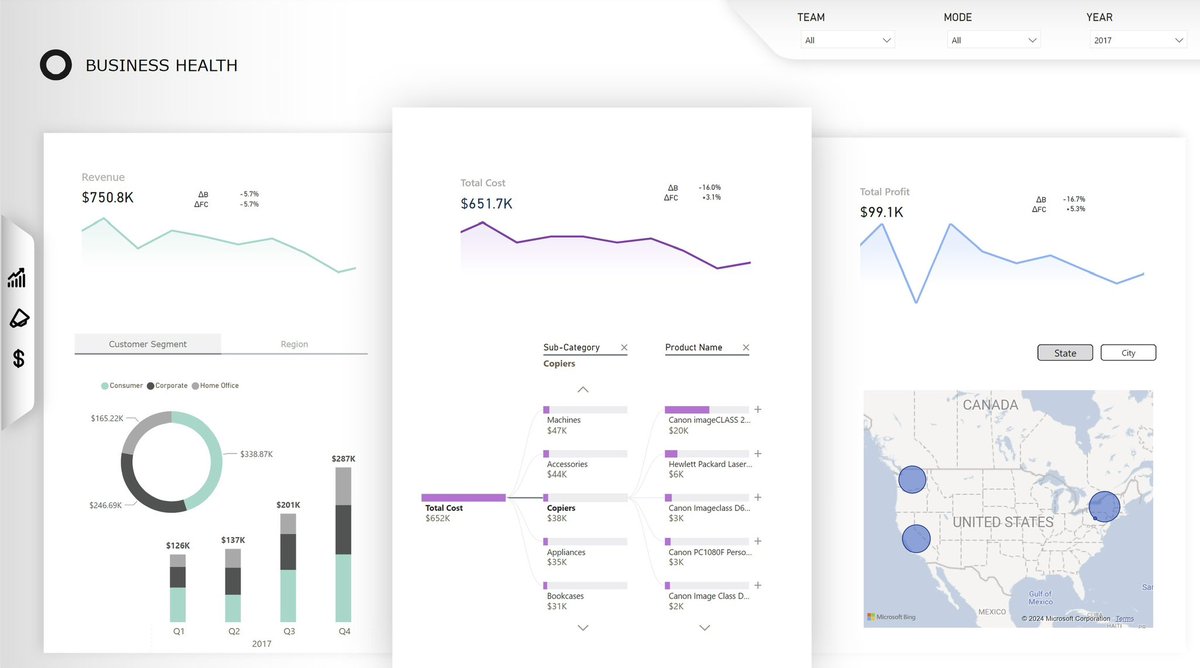
Most analytical reports need more FOCUS 🚀 Agree? #analytics #reporting #business #dashboard #data
How many of your Power BI Reports use Field Parameters: #powerbi #data #design #report
The worst nightmare of a Power BI Developer: the new Power BI Update has everything you report needs but then you realize the latest version you can use is February 2023… 😅🤣 #powerbi #report #dashboard #ux #ui
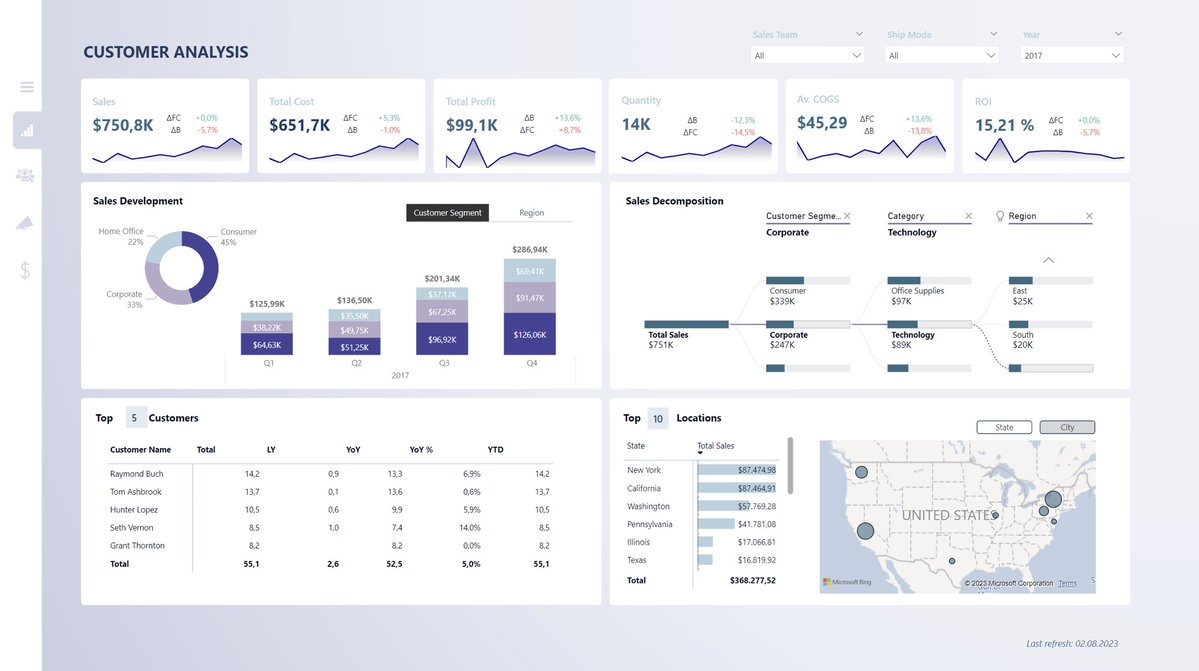
Meaningful, functional and UX optimized report in Power BI 🚀 #powerbi #ux #report #design #analytics #dashboard