
$Trader
@GDXTrader
Experienced and veteran stock trader who specializes in mentoring gold and commodity traders, focusing on technical analysis. Discord http://surl.li/rjoon
𝐆𝐨𝐥𝐝𝐞𝐧👁️ - 𝐏𝐫𝐢𝐜𝐞 𝐏𝐚𝐲𝐬 - 𝐋𝐞𝐚𝐫𝐧 𝐓𝐨 𝐅𝐨𝐥𝐥𝐨𝐰 𝐈𝐭 We keep our trading approach simple—focused on the only true leading indicator: price. Our goal is to help you build a clear, rule-based trading plan grounded in clean price action. Subscribers Receive:…

$CMCL Member Request May 15th marked our last update on $CMCL, following its breakout from a classic cup and handle pattern. See below. For those who acted on the setup, the trade delivered a strong 60% gain in just two months—a textbook follow-through. Price has now…
$CMCL It’s been a while since we last updated on Caledonia Mining—our March 27th post noted the developing setup and potential breakout - and that bullish thesis was confirmed. Today, $CMCL broke above a cup and handle pattern. The move came on strong momentum, finishing the…
$VALE $VALE had a tough week as price was once again rejected at the $10.30 resistance level—a key zone that continues to cap upside momentum. The daily chart has consistently shown sellers stepping in at this level, and the weekly chart now prints a gravestone doji right at…


$ASPI $ASPI is showing a small bullish engulfing candle so far today, as price retests the prior resistance line of its ascending triangle—which now appears to be acting as support. This successful backtest reinforces the breakout structure, signaling that bulls are stepping…


$WTI $WTI bulls are actively defending support at the lower boundary of its ascending broadening wedge, with the last two sessions printing spinning top candles—each showing higher lows and highs but lacking conviction. These spinning tops reflect hesitation, as both the upper…


#GOLD 𝐂𝐨𝐦𝐩𝐥𝐞𝐭𝐞 𝐌𝐮𝐥𝐭𝐢-𝐓𝐢𝐦𝐞𝐟𝐫𝐚𝐦𝐞 𝐕𝐢𝐝𝐞𝐨 𝐁𝐫𝐞𝐚𝐤𝐝𝐨𝐰𝐧 𝐨𝐟 𝐆𝐨𝐥𝐝 𝐍𝐨𝐰 𝐀𝐯𝐚𝐢𝐥𝐚𝐛𝐥𝐞 𝐟𝐨𝐫 𝐌𝐞𝐦𝐛𝐞𝐫𝐬 Join us at goldeneyeanalysis.com On Wednesday, we highlighted that #GOLD had reached horizontal resistance within its ascending…


$UEC If you took the setup we shared on July 10th when $UEC broke out above its rising wedge, you've enjoyed a strong upside move. Last week, price action filled the prior gap, and today we’ve tapped into a key horizontal resistance zone. The last three sessions leading into…
$UEC $UEC pulled back into the neckline resistance zone of its previously confirmed inverse head and shoulders breakout pattern—a level now acting as a key battleground for both bulls and bears. Yesterday’s close below the 50-day moving average raised concern, but today bulls…
$SLB $SLB hasn’t offered much for bulls this week as the stock continues to drift lower within a well-defined descending channel. This week's inside range candle reflects ongoing indecision, with price moving sideways within a consolidation zone that sits inside the broader…

$TSLA $TSLA is set to close the week with a bearish engulfing candle right at the resistance of its symmetrical triangle—a clear sign of hesitation and potential rejection at this key level. This pattern shows that despite early-week bullish attempts, sellers stepped in…


$TLT $TLT is setting up as one to watch closely going into next week. Last week’s candle formed a hammer right at ascending support, signaling that buyers stepped in to defend a key level after early-week weakness. This week, we’re seeing follow-through confirmation, with…

$CLF $CLF rewarded traders who took the falling wedge breakout we highlighted below on June 30th with a strong move higher. After the initial rally, last week’s price action showed healthy consolidation in the form of an inside range candle just below key moving…
$CLF $CLF has been grinding lower within a well-defined descending channel, reflecting a controlled pullback and ongoing bearish pressure. However, today’s price action suggests a potential shift, as bulls are attempting a breakout from the upper boundary of that channel.…
𝐆𝐨𝐥𝐝𝐞𝐧👁️ - 𝐆𝐫𝐚𝐯𝐞𝐬𝐭𝐨𝐧𝐞 𝐃𝐨𝐣𝐢 𝐄𝐱𝐩𝐥𝐚𝐢𝐧𝐞𝐝 A gravestone doji is a bearish reversal candlestick pattern typically seen at the top of an uptrend or near resistance. It forms when the open, low, and close prices are nearly the same, with a long upper wick…

#GOLD Gold continues to show weakness following the bearish engulfing candle on July 23rd, which printed right at overhead horizontal resistance of its ascending triangle—a level that has now rejected price four separate times. The rejection wasn’t subtle either. Wednesday…
#GOLD Gold prints a bearish engulfing candle today right at the horizontal resistance of its ascending triangle—a clear sign of selling pressure as bears step in to reject higher prices. The range continues to tighten as we approach the apex of the triangle, signaling that a…
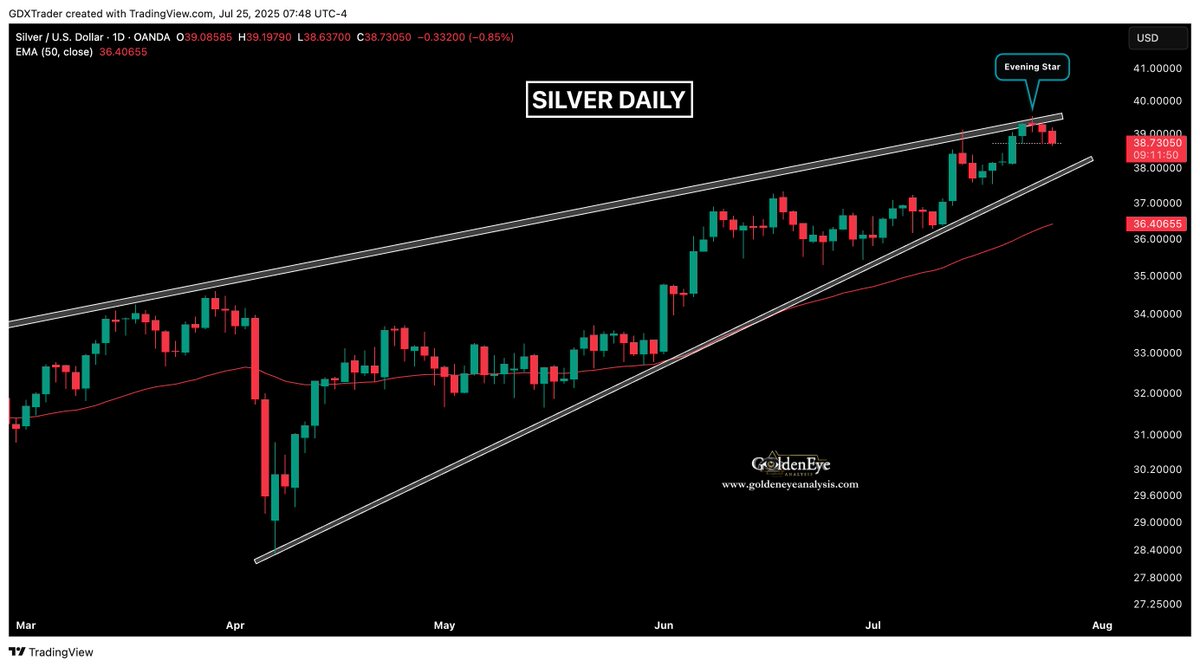
#SILVER Silver completed an evening star pattern yesterday right at the resistance line of its rising wedge—typically a bearish reversal setup signaling a shift in momentum. This three-candle formation reflects exhaustion from buyers after an extended move, with indecision in…


$VLO $VLO is currently forming a bullish harami candle pattern at its ascending support trendline—a key level that has previously acted as a launchpad for buyers. The harami signals a potential shift in momentum, with today’s small-bodied candle forming within the prior…


$OR $OR previously printed a gravestone doji, a few weeks ago, that marked the start of a pullback within a well-formed bull flag, which ultimately resolved to the upside. This candle reflected bullish exhaustion as price pushed higher intraweek but was fully faded by weekly…


$PSX $PSX is currently retesting the prior breakout level of its symmetrical triangle, which also lines up with a key volume profile node—an area where price previously saw heavy activity and interest. This confluence adds strength to the support zone. The Williams Alligator…


𝐆𝐨𝐥𝐝𝐞𝐧👁️ - 𝐀𝐜𝐜𝐮𝐦𝐮𝐥𝐚𝐭𝐢𝐨𝐧 𝐚𝐧𝐝 𝐃𝐢𝐬𝐭𝐫𝐢𝐛𝐮𝐭𝐢𝐨𝐧 𝐋𝐢𝐧𝐞 𝐈𝐧𝐝𝐢𝐜𝐚𝐭𝐨𝐫 𝐄𝐱𝐩𝐥𝐚𝐢𝐧𝐞𝐝 The Accumulation/Distribution Line indicator is a volume-based technical indicator that measures the flow of money into or out of a stock or asset. It helps…

$SLI $SLI has reached its measured move target at the 127% Fibonacci extension following the breakout from its ascending triangle, a classic area where momentum often stalls. Price has been consolidating at this level, suggesting a potential pause in the trend. Yesterday’s…
$SLI $SLI has delivered an exceptional move since the breakout we highlighted at the end of June in the post below, rallying over 40% within just 10 trading sessions. The breakout from the ascending triangle was clean, and momentum has remained strong, with no technical reason…
$DXY $DXY printed a bullish engulfing candle yesterday right at descending support—a key level that also served as prior resistance, now acting as a backtest zone after the recent pullback. Bulls stepped in decisively, reclaiming the prior day's losses and closing near the…

