
Chris Ciovacco
@CiovaccoCapital
Founder & CEO Ciovacco Capital Management. Georgia Tech.
Is the Stock Market Underestimating the August 1 Tariff Deadline? Details, Studies, & Charts: ccmmarketmodel.com/short-takes/ta…

Broad Advance: Always good to identify areas of possible support while things are going well. The NYSE 1500 could hypothetically drop 7.7% and still be near the upward-sloping moving average cluster (30,40, & 50 week MAs). Click image to enlarge.

Earnings this week: Meta and Microsoft on Wednesday, followed by Amazon and Apple on Thursday.
"President Trump said he reached a trade agreement on Sunday with the European Union, avoiding a damaging trade war with the U.S.’s largest trading partner and marking his biggest deal so far in his attempt to remake the global trading system through higher tariffs for U.S.…
The case for a sustained rally in stocks got an additional boost when over 80% of country indexes displayed a positive 252-day rate-of-change, the first such occurrence in more than a year. As illustrated in the chart below, when nearly all international equity markets display…
All four dates below occurred within the context of a secular bull market. #productivity #demographics
Make that 62 trading days in a row the S&P 500 has closed above the 20-day MA. It just passed the 61 from 1998 and is now the longest since 76 in 1997. The longest ever? 101 days in early 1964.
The number of seasonally adjusted initial jobless claims in the United States declined by 4,000 to 217,000 in the week ending July 19, the Department of Labor announced in its report on Thursday. The 4-week moving average fell by 5,000 from the previous week's unrevised average…
Q: Did Initial Jobless Claims shoot higher and break out of the blue box shown on May 1, increasing "imminent recession" concerns? A: No, initial jobless claims fell by 7,000 to 221,000 the Labor Department said Thursday. That’s the fifth straight weekly decline. $SPY $QQQ
"The Dow Jones Industrial Average added to its gains after the Financial Times reported the U.S. and EU were closing in on their own 15% tariff deal. The blue-chip index was recently up about 1%." @WSJ
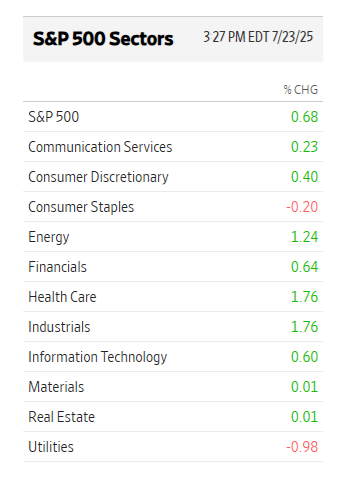
Only red sectors are defensive consumer staples and utilities. $VOO $QQQ $XLK $SMH $XLP $XLU
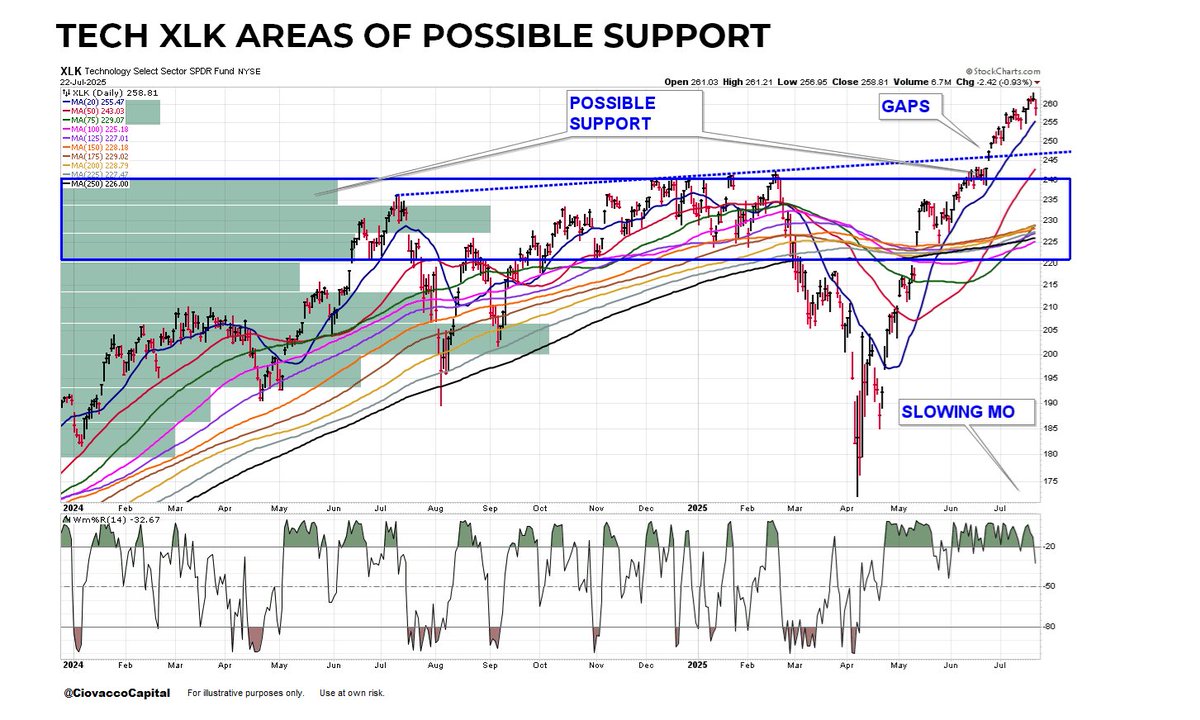
The Tech Sector $XLK has had a great run with a near-vertical look since early April. Since even the strongest uptrends experience countertrends, it is always good to understand areas of possible support. Click image to enlarge.
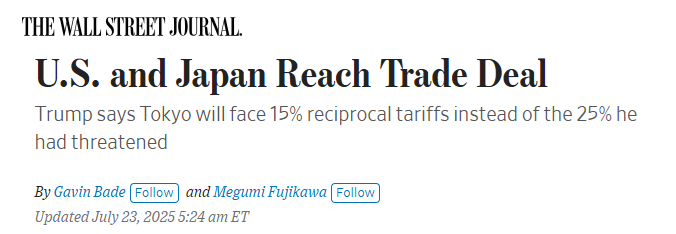
"The U.S. and Japan have reached a trade agreement, President Trump wrote in a social-media post Tuesday evening, saying he would set his so-called reciprocal tariffs at 15% for the country." The Wall Street Journal
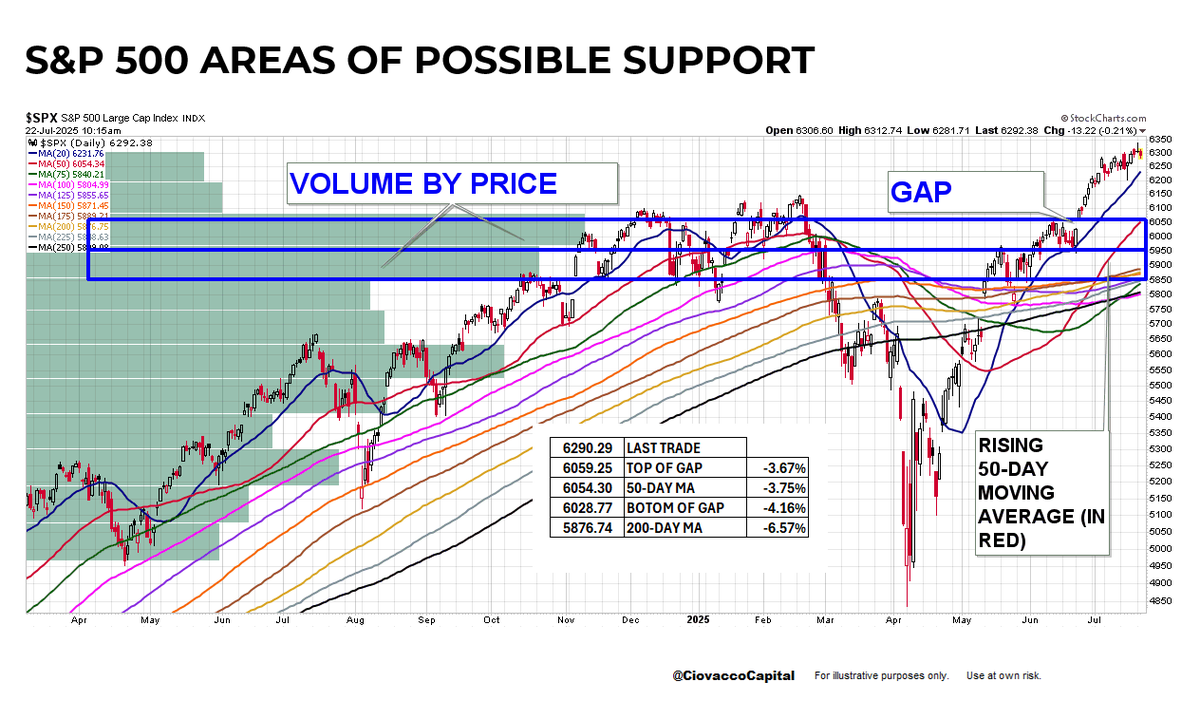
With a Fed meeting on July 30 and August 1 being the deadline for imposing reciprocal tariffs, it is prudent to understand areas of possible support. The S&P 500 could drop between 3.67% and 6.57% without doing significant damage to current uptrend. Click image to enlarge.
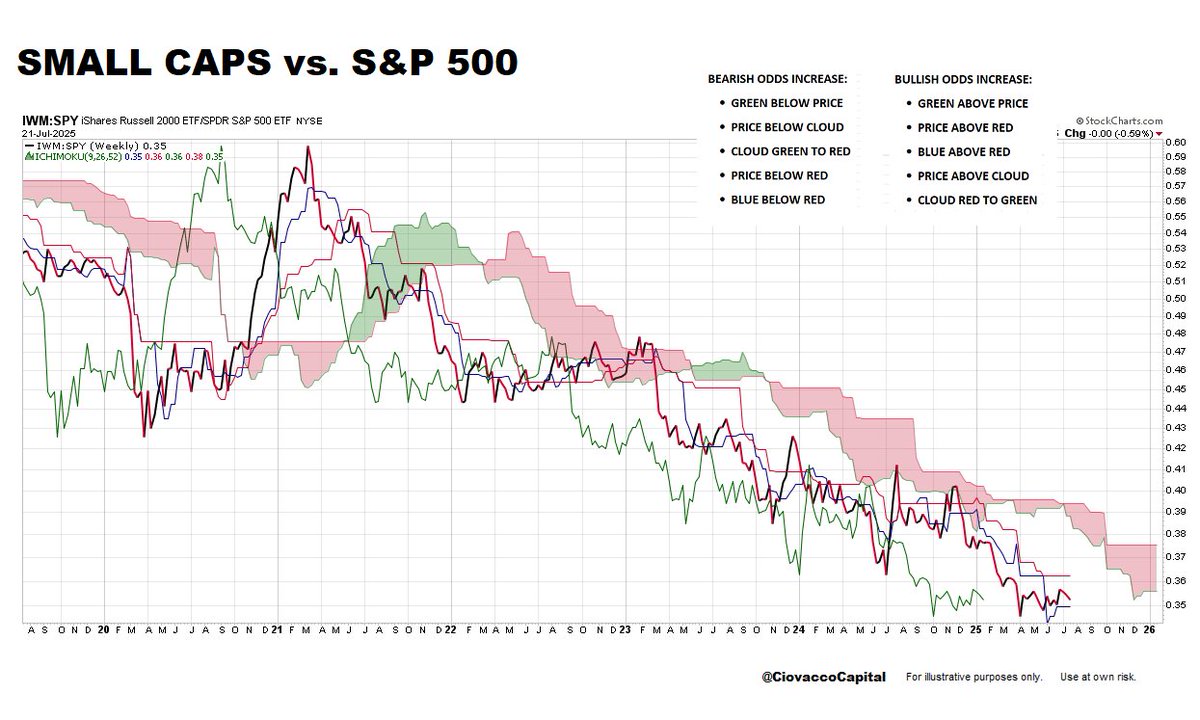
Q: Small Caps vs. S&P 500: How many of the five bullish boxes have been checked in favor of small caps on the IWM:SPY weekly cloud? A: Zero Click image to enlarge.
Aligns with message from charts over the past 90 days:
Trade the chart in front of you.
“If you are depressed, you are living in the past. If you are anxious, you are living in the future. If you are at peace, you are living in the present.” ― Lao Tzu
Helps with maintaining realistic expectations about how markets operate in the real world.
THE FOUR WHALEY S&P QUARTERS It has been my observation the S&P's post 1950 performance breaks down, on average, succinctly into four distinct rolling Quarters peaking during the Turn of Year, Oct27-Jan27, and then degrading over the course of the year until the October 27…
Productivity improvements align with secular bull market thesis. Tech + Demographics.
Revenue per worker has never been higher.