
ChainStats
@ChainStatsPro
Unlocking Web3 Data Like an oil refinery for blockchain, we turn raw data into valuable, data-driven insights, helping users thrive in the Web3 economy
$ONDO is currently tapping a sell block while investors keep their eyes on the $2.10 range. Use our orderbook liquidity maps to see exactly where traders are positioning to buy and where they're looking to offload. $stats

$RENDER orderbook liquidity maps show bids stepping in to walk the price up. A minor sell block is currently being hit. There’s a clear liquidity gap up to $10. If this range breaks with some volume, investors are eyeing that level to take profit. $stats

The alpha isn’t in noise — it’s in the chain. ChainStats gives you the on-chain edge across every network. Real data. Real $stats . Real time. $ETH $DOT $DAG $ADS $BTC many more.....

2 sides of the same beast 🧠⚙️ Left brain: Orderbooks, Hotspots, Netflows, Liquidations Right brain: Node Portal, Raw data flow, Infinite potential One platform. ChainStats. Tap in → chainstats.pro #ChainStats #OnChainAlpha #CryptoTools #NodeAccess $STATS

No desk. No stress. Just on-chain alpha from anywhere. ChainStats keeps you plugged into the markets — even when you're off the grid. $stats

Your new edge in crypto markets is here. 📊 Real-time on-chain intel 📈 Orderbook liquidity maps 🧠 Investor behavior decoded Built for traders who actually give a sh*t about data. → chainstats.pro #ChainStats #CryptoTrading #OnChainData #AlphaHunting $STATS

Liquidity is stacked unevenly right now on $RENDER. There’s a heavy wall of short liquidations sitting above. The question is Which side will the market hunt first? $STATS

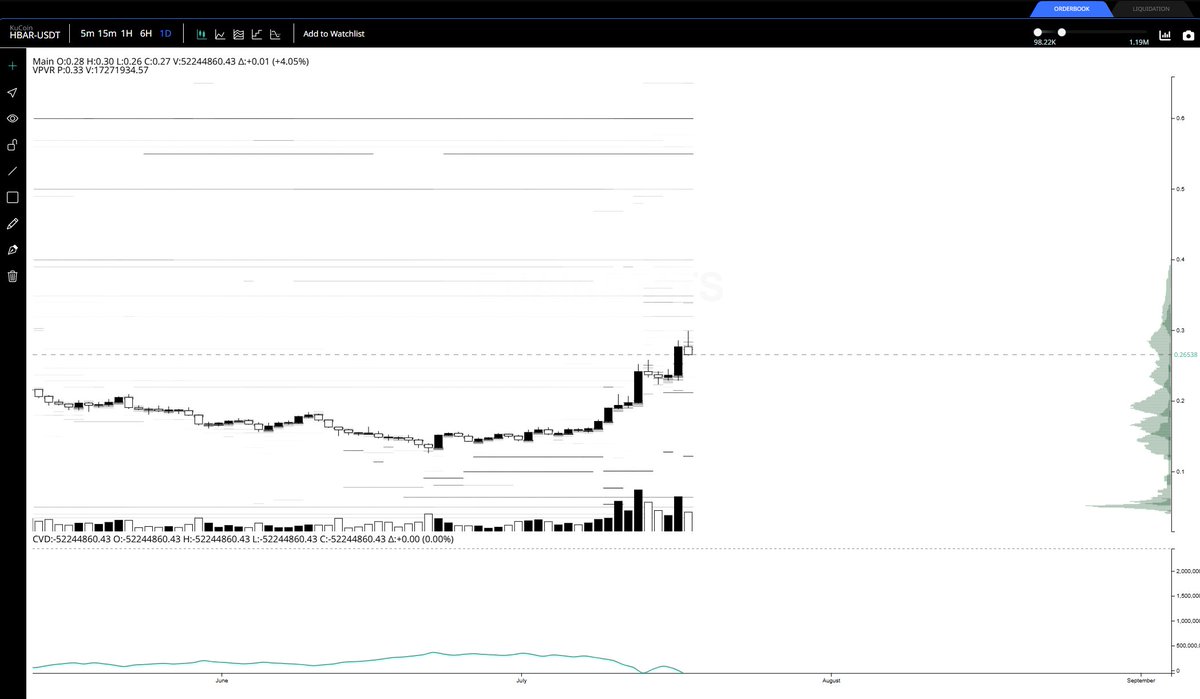
$HBAR starting to make some moves Check the orderbook liquidity maps to spot where investors are planning their take profit pit stops. Right now, we’re seeing a dense liquidity zone starting to cluster around the $0.55 to $0.60 range $STATS
The liquidity gap on $ADS shows investors eyeballing that $.312 as their main area of take profit With just minor sell side liquidity above the current price, the door’s open for capital to rotate in and push this mid cap move into its next leg. $STATS

Curious where $XRP might run into some friction? After a strong rally, our orderbook liquidity maps are showing where traders and investors are starting to take profit. The lines above the current price show where they're positioned to sell, while the ones below highlight where…

ChainStats brings clarity to chaos. Visualize on-chain liquidity, heatmaps, and market depth like never before. No speculation. Just data. Just facts. Just $stats . Empower your decisions with real-time On-Chain Intelligence. chainstats.pro

GM, Fam. Chains don’t sleep. Neither do we. Let’s decode the chain together. $stats
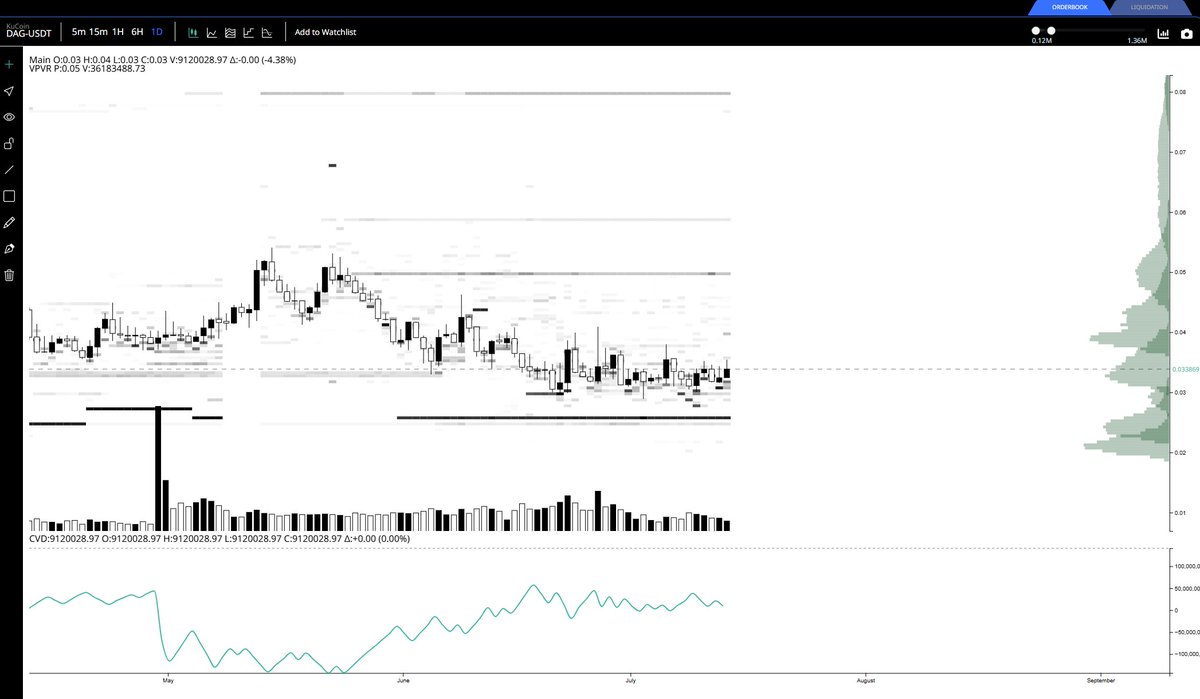
$DAG is starting to lift off the filled resting bids. Take profit orders that were sitting around $.0445 have been pulled, with traders now repositioning closer to $.05. Clear sign they want higher. Get a clear lay of the land and view the full orderbook liquidity maps at…

What is “real” in crypto? On-chain data is real. ChainStats helps you uncover the truth beneath the noise — with powerful blockchain intelligence. Explore more: chainstats.pro

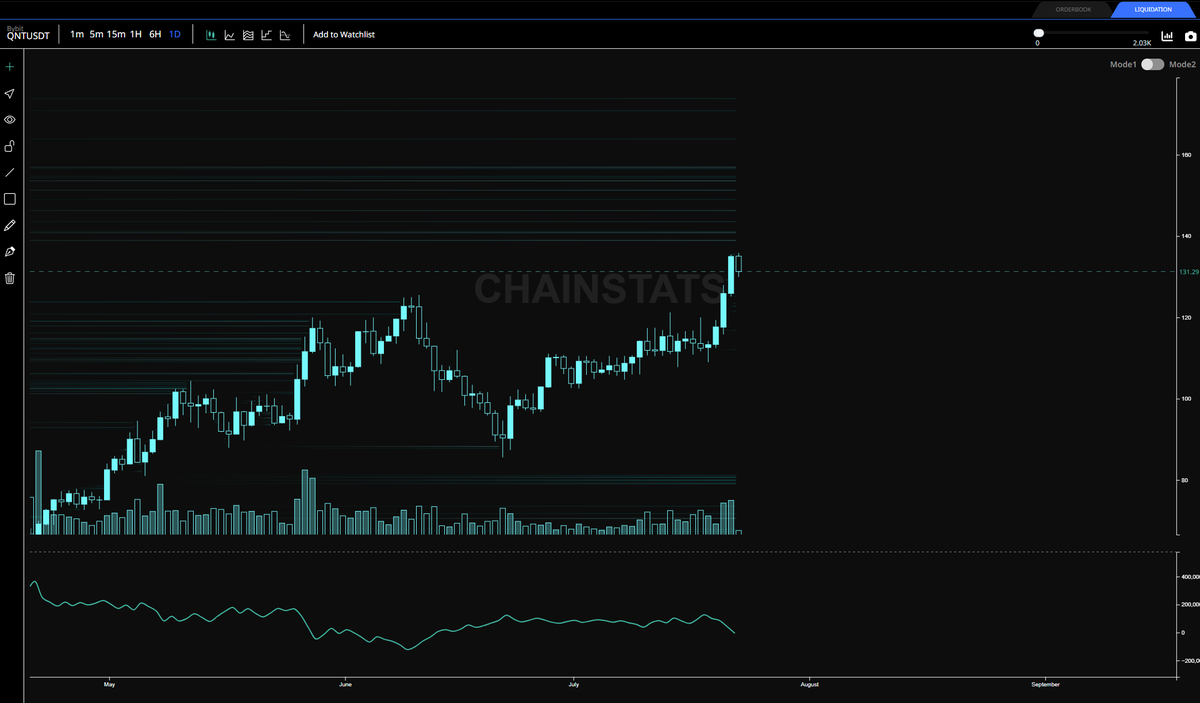
$QNT spot bids are stacking up as it trades between two major bid and ask zones. Resting bids are clearly visible on the chart below the current price, while investor take profit levels are sitting above. Which way will she move? $stats

$DAG is still trading within this range, with a noticeable uptick in orderbook activity. Plenty of buyers and sellers positioning here. Some would call this an accumulation range. Our orderbook liquidity maps show exactly where investors and market makers are placing bids and…
$BTC is currently battling a key take profit zone for some investors, with strong bids stacked down at $105K. Aggregated CVDs are showing a tilt toward spot volume over aggressive market buys, which signals some patience in the order flow. Bulls will want to see more bids step…
