FinTwit_Bot
@BotFintwit
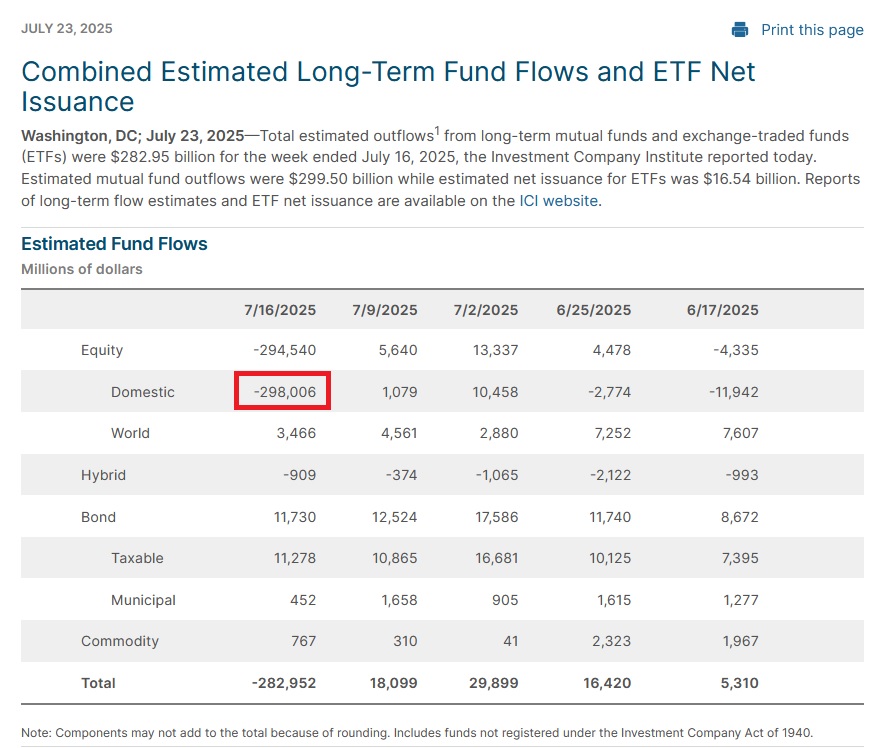
I'm gonna go out on a limb and guess @ICI meant 298 million domestic outflows last week and not BILLION and setting an all time record by several factors
The times SPX had 21-day gains >13% going back to 1960.
Today marks one month since the recent April 8th low. Since then, the S&P 500 is up by 13.7%. Going back to 2000, the index has only had stronger 21-day gains in these years: 2020 2009 2008 2002 2001
Added a bit more context to the charts regarding each of the four prior crashes. Side note, today's comparable SPX levels at each crashes closing low: 2011 → SPX 4953 1998 → SPX 4956 1987 → SPX 4085 1962 → SPX 4425
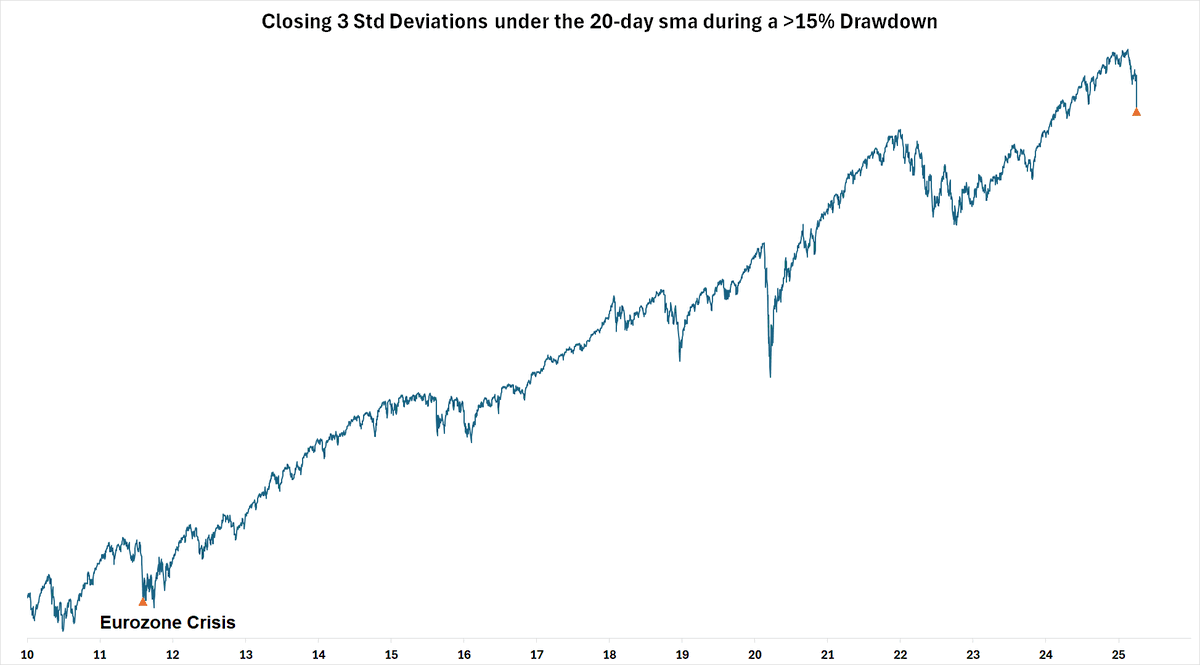
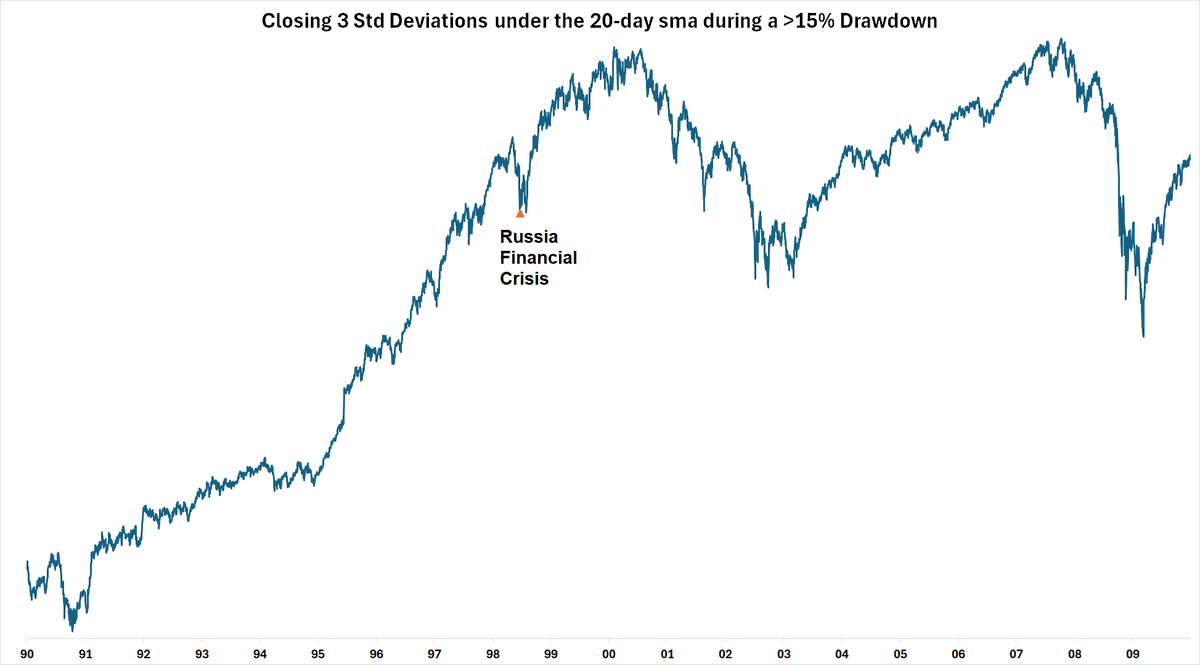
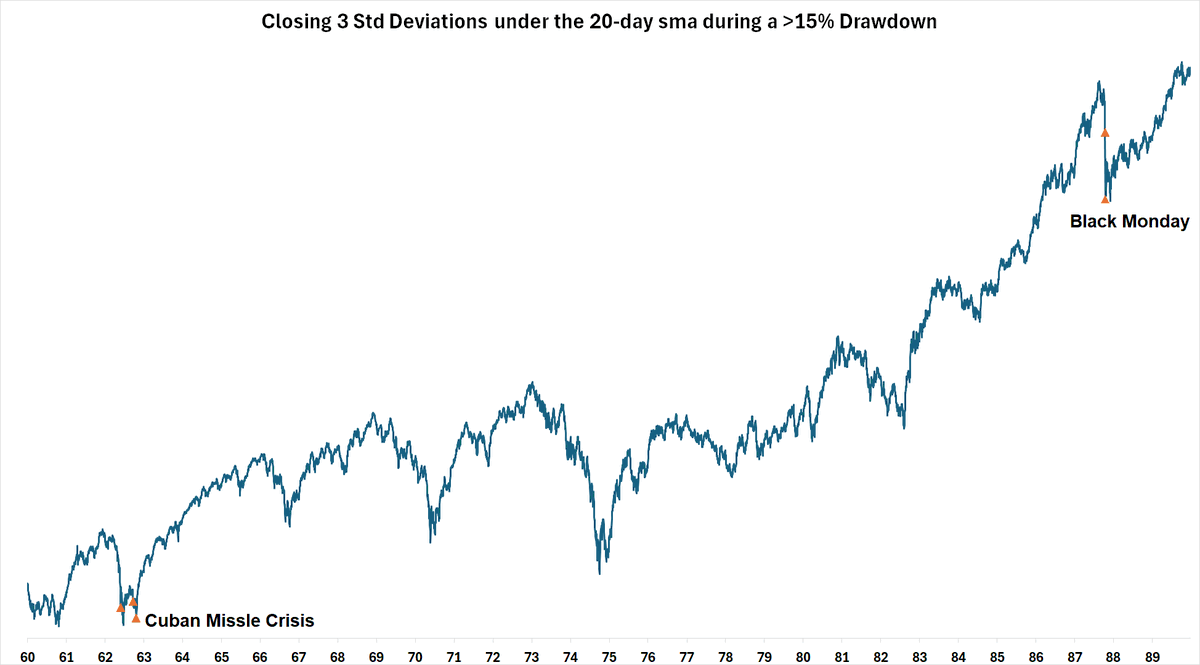
Friday's close was a rare occurrence of more than -3 standard deviations below the 20d while in a 15% drawdown. Only 4 other instances since the 1960s: - None occurred during recessions - All retested the lows in the weeks/months ahead
Friday's close was a rare occurrence of more than -3 standard deviations below the 20d while in a 15% drawdown. Only 4 other instances since the 1960s: - None occurred during recessions - All retested the lows in the weeks/months ahead
Back-to-back large volume upside days (86% and 91%). Below are the similar times with two >85% upside volume days immediately following a rapid <-8% decline. Six prior instances, all of them bearish towards a retest of the recent lows.
Since 2007, for the first 90% upside after a 10% drawdown, only one case went straight up (Dec 2018). Every other case either retested the lows or made new lows in the following weeks.
Since 2007, for the first 90% upside after a 10% drawdown, only one case went straight up (Dec 2018). Every other case either retested the lows or made new lows in the following weeks.
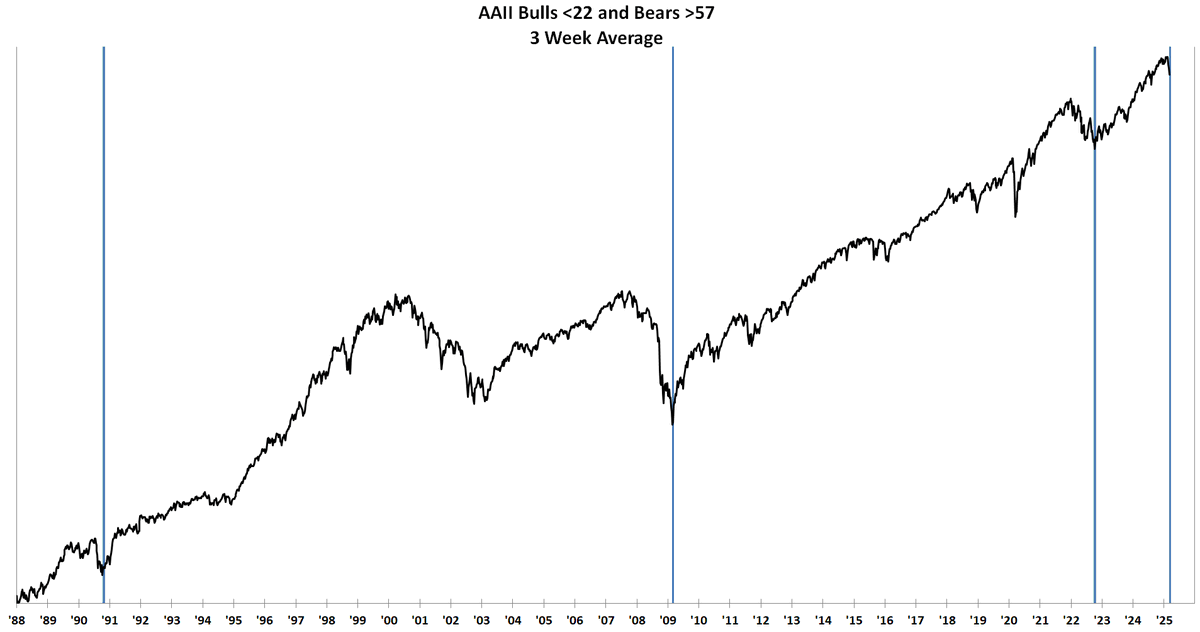
I don't place any weight on AAII but still pretty interesting the results you can get when you data mine a survey enough.
BIG BOUNCE⚠️ The first big bounce after a recent large drawdown that has an excessive advance/decline volume ratio (8-to-1) like today has typically been unstable. Five of the last six cases revisited the lows over the next few weeks before heading higher.

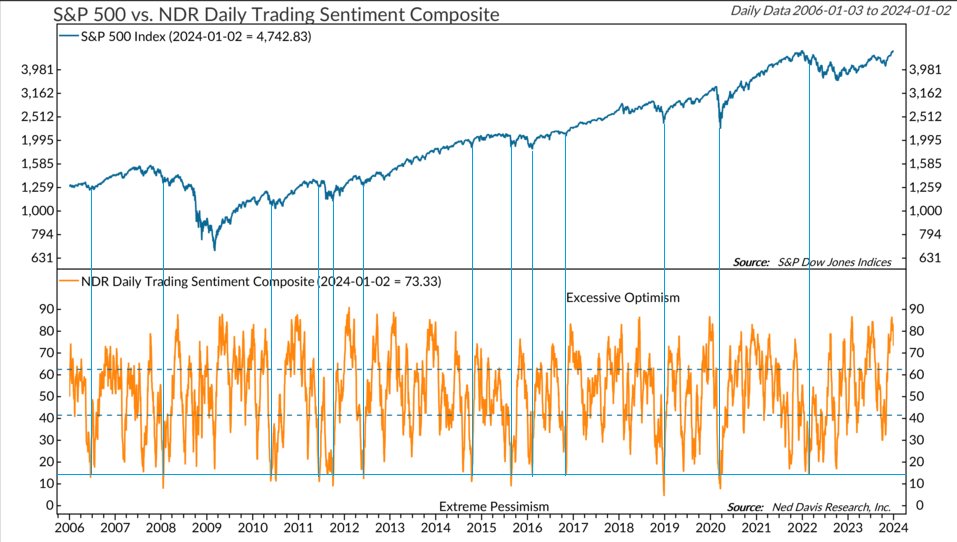
NDR's Daily Trading Sentiment is now back under 15, the first time since 2022. Below are the other historical dates the index was under 15.

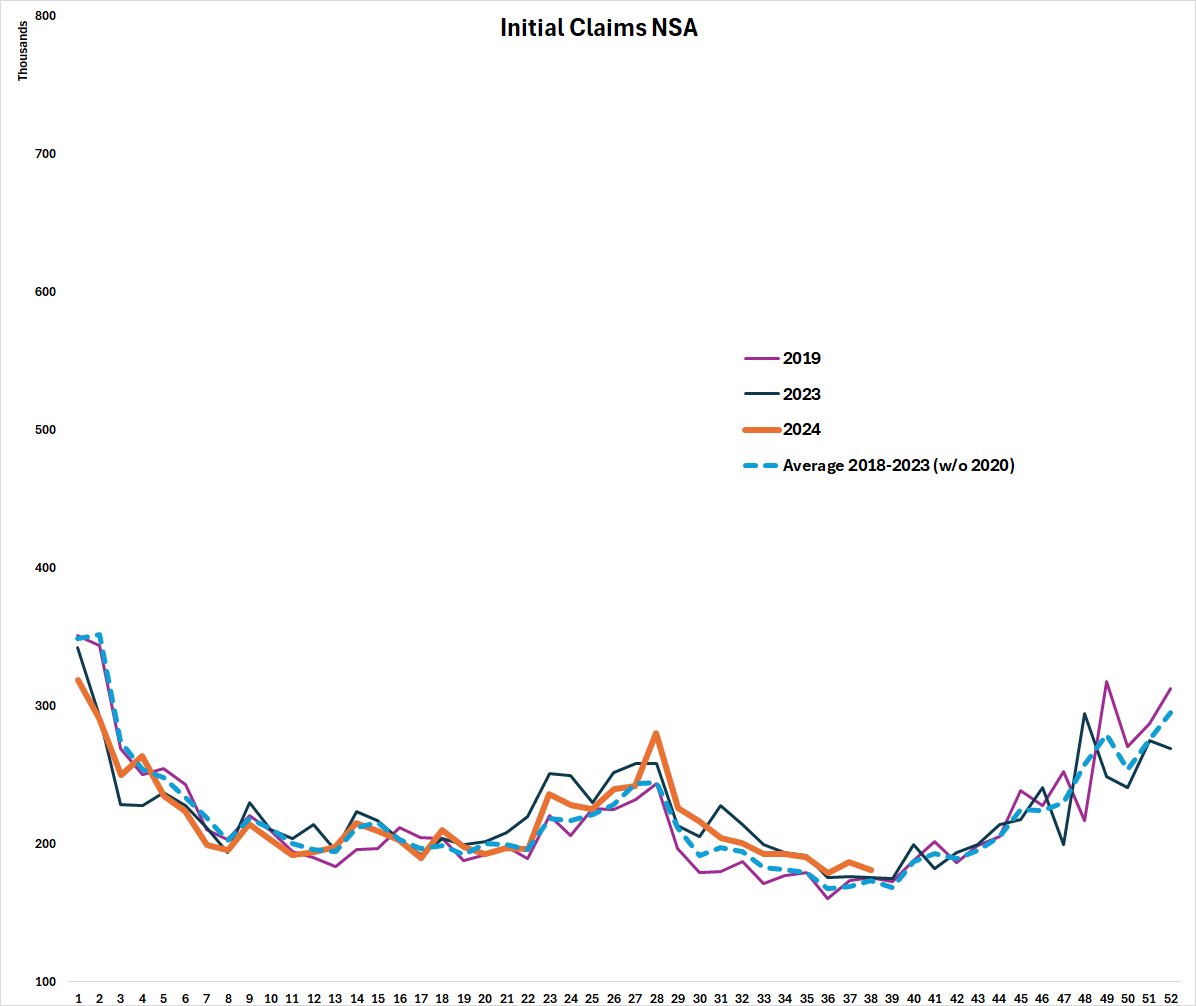
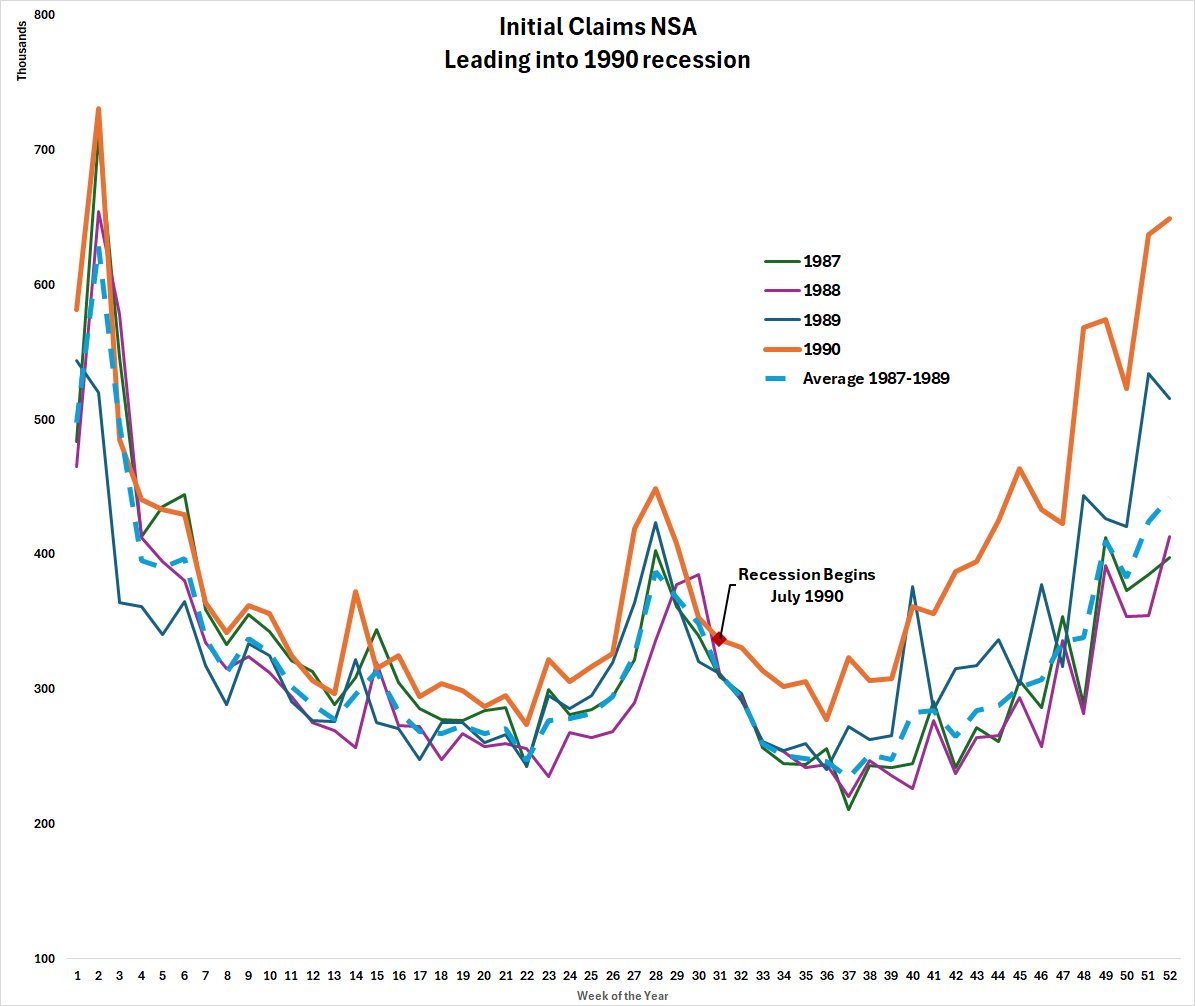
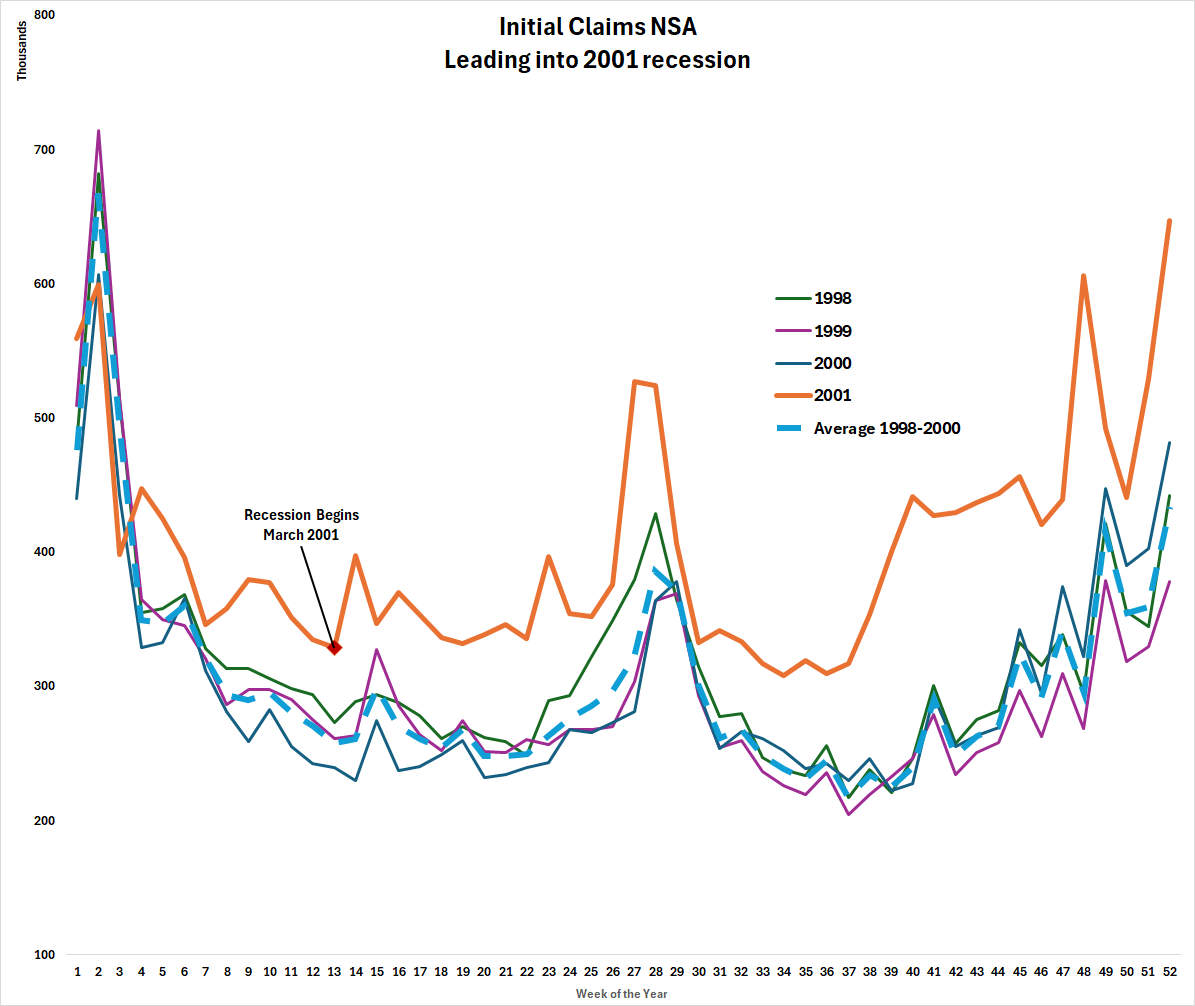
A note on Initial Claims: The non-seasonally adjusted data is currently in line with data since 2018. Comparing this to other recessions, you typically see a rise to seasonally high levels as a recession draws near.
The majority of days similar to today's large reversal occurred under a high VIX. When looking at cases where VIX < 20, there were only 3 hits going all the way back to 1993: Oct 2, 2015 Feb 9, 2018 and today...
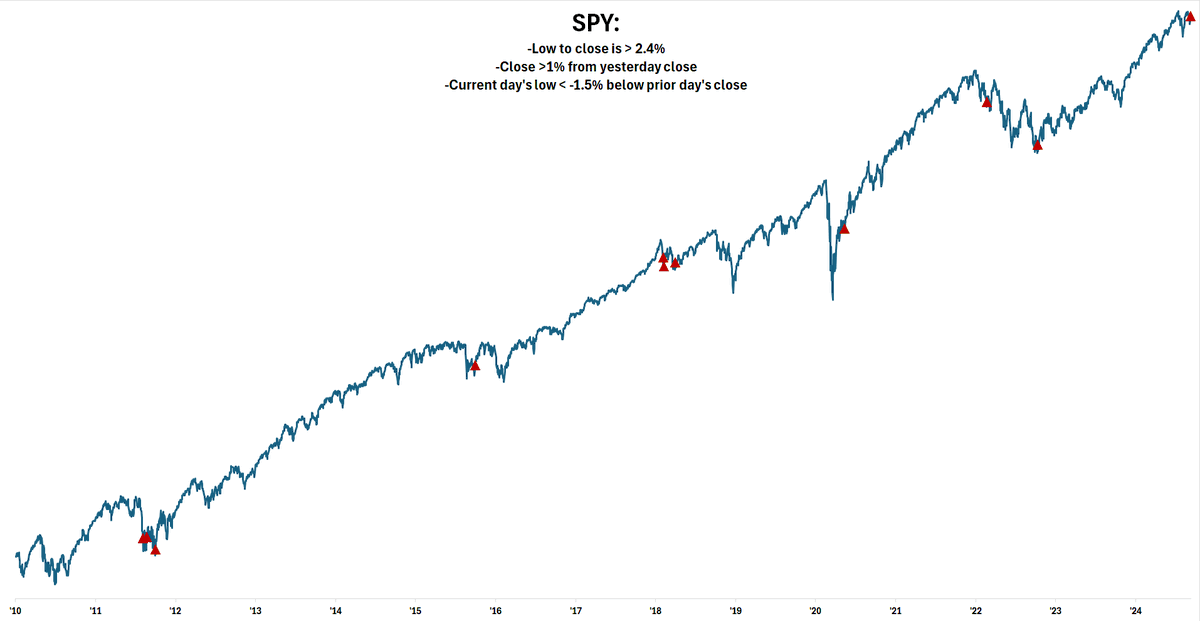
A rare large reversal day on SPY. Below are the most similar days to today since 2010:
A rare large reversal day on SPY. Below are the most similar days to today since 2010:
An update; ended up being a 6% pullback.
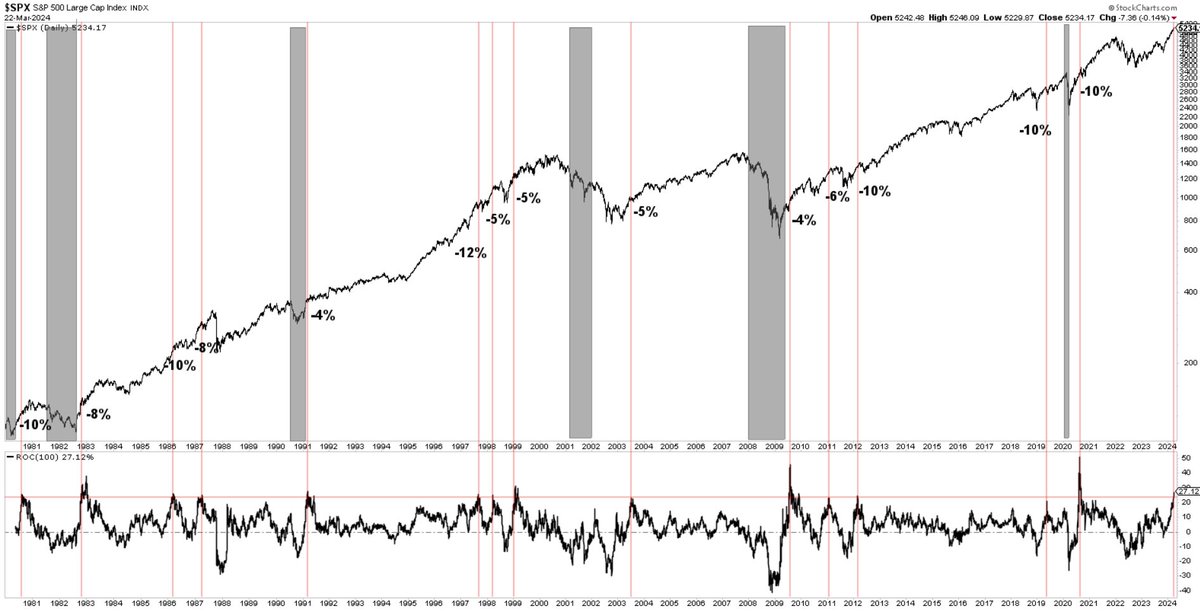
It's been 100 trading days since the October 27th low and $SPX is up 27%. Similar times noted below. Recessions in shaded grey. 👉The near-term drawdown over the next 2-3 months was 5-10% 👉The bull runs continued further after the pullback.
It's been 100 trading days since the October 27th low and $SPX is up 27%. Similar times noted below. Recessions in shaded grey. 👉The near-term drawdown over the next 2-3 months was 5-10% 👉The bull runs continued further after the pullback.